By Rustin Bielski
Salish Kootenai College
Introduction
Over 87% of the world’s flowering plants depend on pollinating species to seed and reproduce.1 Direct and indirect factors have contributed to the loss of native pollinators, including pesticide use, habitat destruction, and changes in weather patterns. Because of human influence on the environment, the bumble bee population has declined by half in North America2. Furthermore, the chances of a single bumble bee population surviving are 30% less than it was one generation ago. 2 About one half of the 260 species of bumble bees found globally have been assessed; of those, one third have been found to be threatened with extinction.3
While bumble bees only make up a fraction of the total pollinator guild, they are important because they deploy unique methods of pollen and nectar collection which prove beneficial to the flower more so than most pollinators. For one, bumble bees are among the few pollinator species which intentionally collect pollen for consumption rather than only utilizing the flowers for its nectar. Bumble bees effectively and efficiently gather pollen by hanging from the bottom of some flowers and oscillating their flight muscles at around 120 to 400 Hz, shaking the pollen off of its anthers.4 This method is crucial to the pollination of a group of analogous flowers containing poricidal anthers, which make up roughly 8% of all angiosperms. Flowers containing poricidal anthers are specially adapted to only release pollen when agitated, exclusively taking advantage of buzz pollinating species.5 Co-evolution between these flowers and their buzz-pollinating counterparts have existed for thousands of years, each depending on one-another niche differentiation from other flowers/pollinators. Throughout the world, sympatric flowers and bumble bees depend on each other for survival, and some of the plants sustained by bumble bees contain ecosystem properties which make for a healthy, diverse environment.
Similar to the loss of pollinators, the loss of native vegetation not only leads to unhealthy ecosystems, but also takes from the intrinsic and cultural values of an environment. In many cultures around the world today people are still dependent on gathering food naturally from their environment rather than a grocery store. In North America, where agriculture dominates wild harvested food, many people, especially those of Native American communities, use wild plants traditionally and ceremonially for food and medicine. In the Pacific Northwest, Blue Camas (Camassia quamash) is an early season blooming flower that is culturally important to many tribes as a primary food source, as well as imperative to many animals including grizzly bears, deer and elk.6 The natural prairie ecosystem where Blue Camas grows is now 3% of what it was 200 years ago, and it is known that exotic plants (especially grasses) are a major threat to its survival.6 Throughout North America, there are many examples of important native plants being choked out by foreign invaders.
Native plants and their communities have ingrained methods of symbiosis with one another, evolving together over thousands of years and when exotic plants are introduced, they can be extremely tenacious. Once established, exotic plants (especially those classified as noxious weeds) begin to eliminate the biodiversity of the community by way of competitive exclusion. Pervasive plants rid their native competitors by stealing sunlight, nutrients, water, pollinators, and even changing the soil chemistry.7 Non-native plants are just as pollinator dependent for fecundity and survival as native ones, yet an area invaded by non-natives has no more pollinators than an unadulterated one. It is little understood what happens with nutrient quality and quantity available for pollinators once a habitat is invaded.8 What has been well documented is plant community composition changes after invasion, but what needs more understanding is how these changes affect higher trophic levels. Heather (Calluna spp.) for instance, is known to carry the chemical callunene in its nectar, which acts as a natural bee medicine due to its ability to reduce infectivity of Crithidia bombi, a parasite.9 One of the reasons for loss of heathlands is invasion of noxious weeds, and this loss could bolster disease among the bee community. Bumble bees have coexisted and coevolved with the flowers endemic to them, and have adapted a long proboscis (tongue) to gather nectar from flowers with deep corolla tubes, a Darwinian way of partitioning resources between them and other pollinators who rely on more shallow corolla species Because of their tongue length and body size bumble bees have a limited selection of flowers they can effectively pollinate.10 One of the many reasons invasive plants are so successfully pervasive is due their ability to be resource generalist, surviving in a wide scale of environments and being able to utilize many pollinators, rather than just ones with longer tongues.
The focus of this investigation is of the resource preference of bumble bees between native and non-native plants. Understanding this can be crucial to gaining insight on the recent decline of bumble bee species in North America as well as constructing a plan for conservation.11 In Montana (USA) there are 28 species of bumble bees, more so than any other state, and a reported decline of at least two species.12 However, as the number of bumble bees goes down, the number of non-native and invasive plants is going up. In 2016 Montana had over 8 million acres infested with noxious weeds alone, 8.8 percent of the entire state.13 The number one invasive plant being spotted knapweed (Centaurea stoebe), covering over 2 million acres. The comparison of bumble bees and non-native plants can be done with an analysis of preference among a community of flowers incorporating both native and non-native flowers, and the best way to do this is with a floral visitation record.14 A statistical estimation of preference can be done using an estimation of flower availability relative to the use of the flower.15
This investigation took place on the Flathead Indian Reservation, in the Northwest corner of Montana, and covered the entire flowering season of plants. When considering this study, the question was asked: Do bumble bees utilize native plants for a food source more so than non-native plants during their foraging season? It is currently thought that bumble bees forage stochastically, and simply pollinate purely based on abundance. However, due to increasing evidence of established symbiotic relationship and diet specialization including evolved pollen and nectar gathering appendages perfectly suited to certain flowers, bumble bees might pollinate majority native flowers throughout the season.
Materials and Methods
The study site was located at Kicking Horse Wildlife Mitigation Area near the town of Ronan, Montana (47.4809024, -114.0752979). The ecosystem habitat type is a bunchgrass prairie with pothole wetlands intermixed, but all flowers surveyed were upland plant types. Field observations took place from May 9, 2020 to August 24, 2020.
Floral diversity and relative abundance surveys were replicated from Gillespie, S., Bayley, J., & Elle, E. (2017).16 These surveys were done at the start of the day, on each day observations were made. Randomly selected within the site, four 50-meter quadrants were chosen, each spaced 50 meters apart. Along each transect line 10 quadrants were placed five meters apart. Each quadrant measured .25 x 2 meters. Within each quadrant flowering stems were counted for each species present, and only species containing flowers large enough for bumble bees to utilize were counted. Plant species identification was done using Kershaw, Mackinnon and Pojar’s “Plants of the Rocky Mountains.”17
The first and primary method for analysis was a 15-minute focal observation of a select flower species for bumble bee pollination. A 4×4 meter quadrant was delineated for each given plant species, and every plant species blooming at the time was observed on that day. A timer was used, and each bumble bee that was seen pollinating a flower was tallied.
The second method implemented was a ~30-minute sweep net capture along fixed transect lines based on Harmon‐Threatt, A.N. and Kremen, C. (2015)8. Three 500-meter-long transect lines were randomly chosen, running parallel, 100 meters apart. One person walked along transect lines at a moderate speed making observations. When a bumble bee was recognized, it was captured, and the target flower was recorded.
Results
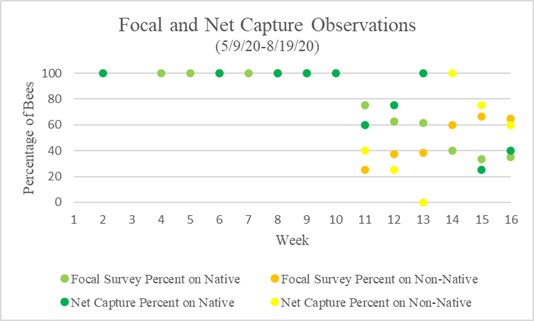
In total 133 bumble bees were observed through both methods of data collection, 77 of the bees (59%) were seen on native flowers and 49 (41%) were seen on non-native. Chart 1 above represents the average percentages of weekly observations in both focal survey and sweep net capture observations. Focal surveys and sweep net captures showed a similar trend. Week 1 through 10 showed no bumble bees on non-native flowers in both methods of observations. From week 10 through 16 there is a downward trend of bumble bees seen on native flowers, but never less than 20% of bees were seen on native flowers. Bumble bees began to appear on non-native flowers in week 11, and by week 14 more bumble bees were observed on them. Floral diversity metrics can be calculated using Simpson D diversity index with calculated values ranging from 0 to 1, one being highest diversity and 0 no diversity. Compared alongside flower diversity was the total bumble bees observed, which is a combined total of all bumble bees seen per week through focal surveys and captures. Relative abundance regarding native vs non-native was calculated per day of observations.
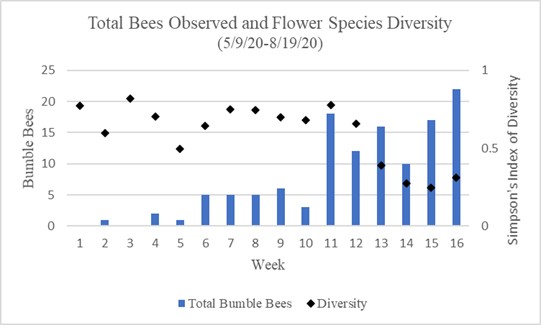
Chart 2 shows the total bumble bee observations per week in relation to flower density represented using Simpson’s Index of Diversity. This incorporates both focal surveys and sweep net capture surveys. Weeks 1 through 10 show less than 7 bees observed per week. Weeks 1 through 10 also show a relatively high amount of diversity in flowering species. Weeks 11 through 16 show 10 or more bumble bee observations per week, with the highest amount seen in the 16th week. Weeks 11 through 16 also show a downward trend in flower diversity with the lowest diversity being in the 15th week.
Preference of native and non-native can also be calculated using Ivlev’s electivity index based on Strauss R. 1979.18 Values represent a level of preference between (1) and (-1), one being highest preference and negative one being lowest, while a zero value means no preference or equal to abundance.
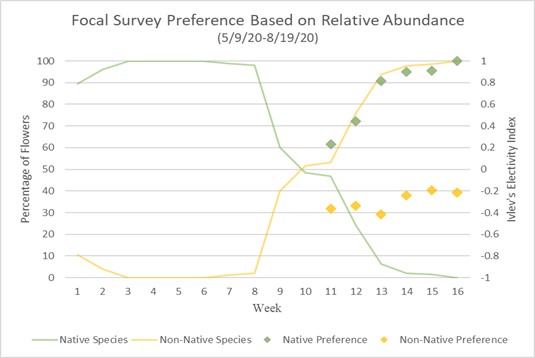
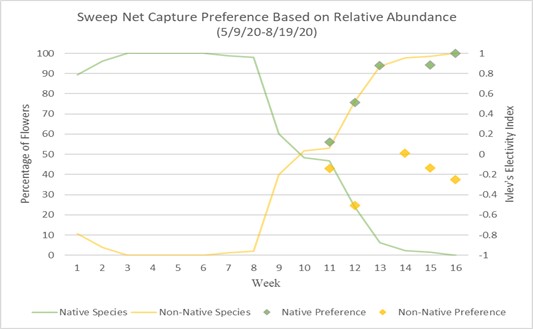
Charts 3 and 4 compare preference based on Ivlev’s electivity index to relative abundance of native and non-native flowers. Chart 3 uses the method of focal surveys and chart 4 uses the method of sweep net captures. The relative abundance of flowers is the same in both charts. The abundances of native and non-native flowers shown is inversely proportionate because they are percentages of total flower population. From weeks 1 through 8 native flowers dominate the landscape with nearly 100% abundance. During week 8 native flower population starts to decline and non-native flowers begin to take over. During week 10 the abundance of native and non-native is about even. From week 10 forward, non-native flowers begin to take over, and in week 16, 100% of the landscape is non-native abundant. When examining bumble bee preference of flowers, weeks 1 through 10 are not shown because there are not enough observations of non-native flowers to justify an accurate assumption of preference. Weeks 11 through 16 show a majority-native preference proportionate to the percentage of native flowers declining. Trending upward from week 11, by week 16 native flowers are completely preferred over non-native flowers due to there theoretically being zero native flowers available.
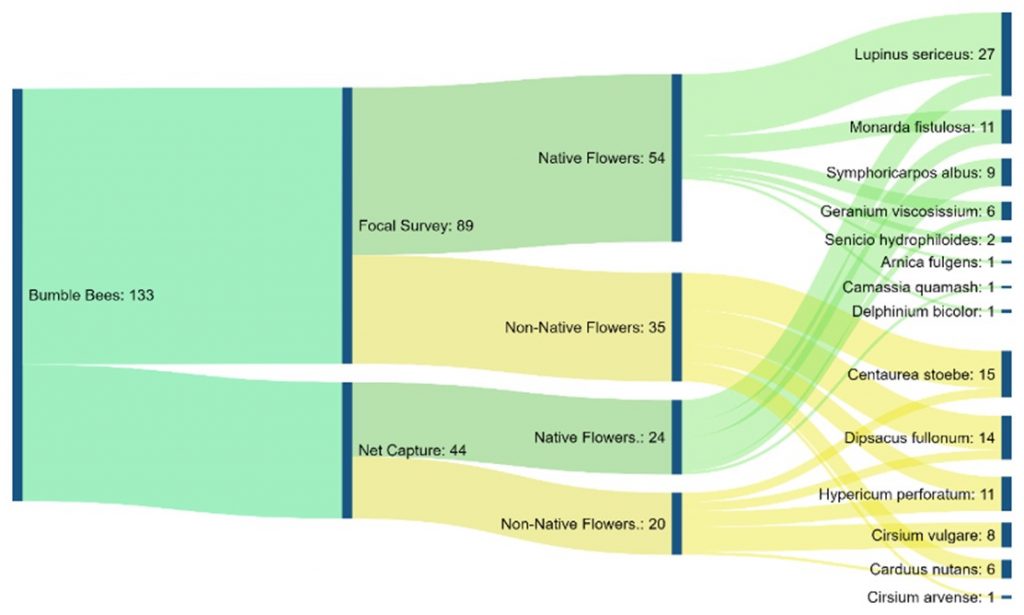
Chart 5 is a flow chart of total bumble bee observations from both methods. It shows all flowers bees were observed on and the total observations per flower. The chart also displays the amounts of observations split into each method used, and furthermore into the category of native or non-native per each method.
Discussion
This study analyzes wild bumble bee pollination of native plants compared to pollination of non-native plants during the foraging season. When comparing the number of bees seen on native plants throughout the season to the number of native plants available throughout the season, there were proportionately more bumble bees visiting native plants than non-native plants. Similar results were found with the 15-minute focal survey samples and the net capture samples. This was tested using different types of statistical analysis tests, each of which showed that the rate at which bumble bees select flowers to pollinate was not due to random chance or dependent on the availably of flower types. This was evident in both methods of data collection. During the weeks when there were enough observations of bumble bees and enough native and non-native plants to calculate preference, bumble bees preferred native flowers. When the abundance of flowers was native, bees were seen almost exclusively on native flowers. As the abundance of native flowers began to decline so did observations of bumble bees on native flowers and more bees were seen on non-native species. There were significantly more bees seen in the latter half of the season, however this was also when non-native plants were more abundant. Additionally, the diversity of flower species dropped in this latter half of the season. Intriguingly, for the first five weeks of observation almost no bumble bees were observed, yet there were many native flowers present. The winter leading into this study was very mild, and snowfall was less than average in the area. This may have had an effect such as flowers blooming earlier than normal during the spring season.
References
- Ollerton, J., Winfree, R. and Tarrant, S. 2011. How many flowering plants are pollinated by animals? Oikos, 120: 321-326. doi:10.1111/j.1600-0706.2010.18644.x
- Soroye P, Newbold T, Kerr J.2020. Climate change contributes to widespread declines among bumble bees across continents. Science. 6478: 685-688. Retrieved from: https://science.sciencemag.org/content/367/6478/685
- Arbetman M, Gabriela G, Aizen M. 2017. Global decline of bumblebees is phylogenetically structured and inversely related to species range size and pathogen incidence. Proc Biol Sci. 284(1859): 20170204. Retrieved from: https://www.ncbi.nlm.nih.gov/pmc/articles/PMC5543210/#!po=71.8750
- Miller-Struttmann NE, Heise D, Schul J, Geib JC, Galen C 2017. Flight of the bumble bee: Buzzes predict pollination services. PLOS ONE 12(6): e0179273. https://doi.org/10.1371/journal.pone.0179273
- Harder, L. D., and R. M. R. Barclay. 1994. The Functional Significance of Poricidal Anthers and Buzz Pollination: Controlled Pollen Removal From Dodecatheon. Functional Ecology. 8, no. 4: 509-17. doi:10.2307/2390076.
- Lincoln A. Brooks R. Hamman S. 2018. Off-Target Impacts of Graminoid-Specific Herbicide on Common Camas ( Camassia quamash ) Growth, Abundance, Reproduction, and Palatability to Herbivores. Northwest Science. 92(3):166-180. DOI: 10.3955/046.092.0304
- Zevit P. Battling the Alien Invasion: An overview of invasive plant species impacts in the Georgia Basin. In Klinkenberg, Brian. (Editor) 2020. Biodiversity of British Columbia Lab for Advanced Spatial Analysis, Department of Geography, University of British Columbia, Vancouver. Retrieved from: https://ibis.geog.ubc.ca/biodiversity/BiodiversityandInvasiveSpecies.html
- Harmon-Threatt A, Claire K. 2015. Bumble bees selectively use native and exotic species to maintain nutritional intake across highly variable and invaded local floral resource pools. Ecological Entomology. UC Berkeley. 40, 471–478. DOI 10.1111/een.12211
- Koch et al., 2019, Flagellum Removal by a Nectar Metabolite Inhibits Infectivity of a Bumblebee Parasite. Current Biology 29, 1–7. https://doi.org/10.1016/j.cub.2019.08.037
- Peat, J., Tucker, J. and Goulson, D. (2005), Does intraspecific size variation in bumblebees allow colonies to efficiently exploit different flowers?. Ecological Entomology, 30: 176-181. doi:10.1111/j.0307-6946.2005.00676.x
- Kleijn D, Raemakers I. 2008. A retrospective analysis of pollen host plant use by stable and declining bumble bee species. Ecology. 89(7):1811-23. DOI: 10.1890/07-1275.1
- Dolan, Amelia C., Casey M Delphia, Kevin M. O’Neill, and Michael A. Ivie. “Bumble Bees (Hymenoptera: Apidae) of Montana.” Annals of the Entomological Society of America 110, no. 2 (September 2017): 129-144. DOI: 10.1093/aesa/saw064.
- Office of the Governor. 2017. Montana Noxious Weed Management Plan. State of Montana. Retrieved from: https://agr.mt.gov/Portals/168/Documents/NWTF/MT%20Noxious%20Weed%20Management%20Plan-%20Update%202017.pdf
- Harmon‐Threatt, A.N., de Valpine, P. and Kremen, C. (2017), Estimating resource preferences of a native bumblebee: the effects of availability and use–availability models on preference estimates. Oikos, 126: 633-641. doi:10.1111/oik.03550
- Aarts, G., MacKenzie, M., McConnell, B., Fedak, M. and Matthiopoulos, J. (2008), Estimating space‐use and habitat preference from wildlife telemetry data. Ecography, 31: 140-160. doi:10.1111/j.2007.0906-7590.05236.x
- Gillespie, S., Bayley, J., & Elle, E. 2017. Native bumble bee (Hymenoptera: Apidae) pollinators vary in floral resource use across an invasion gradient. The Canadian Entomologist, 149(2), 204-213. doi:10.4039/tce.2016.67
- Kershaw L, Mackinnon A, Pojar J. 2017. Plants of the Rocky Mountains. 2nd edition. Partners Publishing. 384 p. ISBN: 978-1772130294
- Strauss R. 1979. Reliability Estimates for Ivlev’s Electivity Index, the Forage Ratio, and a Proposed Linear Index of Food Selection. Transactions of the American Fisheries Society. 108(4):344-352. DOI:10.1577/1548-8659(1979)108<344:REFIEI>2.0.CO;2
Acknowledgement
The author would like to thank the faculty at Salish Kootenai College for their support and services in completing this research.
About the Author

Rustin Bielski is a student at Salish Kootenai College currently in his third year of the Wildlife and Fisheries Management Program. He is a resident of the Flathead Indian Reservation, and draws on the natural landscape and wilderness areas for his studies and explorations. Maintaining a 4.0 GPA, Rustin also works as a math tutor and serves as vice-president of the SEEDS Ecology Club, where he helps with campus native plant restoration, and the plastic recycling campaign. Rustin enrolled in Salish Kootenai College with the hope of being the first in his family to obtain a bachelor’s degree and is currently looking into grad school opportunities as well. He believes modern society’s current way of life is not sustainable, and changes must be made to make the health of our planet a number one priority. He hopes to do this by giving evidence of the destruction mankind is doing, using environmental research as a tool.
• • •
Enjoyed this story? Enter your email to receive notifications.