
By Jenny Brown
Kapiʻolani Community College
Abstract
Kapiʻolani Community College’s greenhouse preserves native plants to combat climate change and educate the community. Its current irrigation timer device is expensive, unreliable, and requires a complementary system that monitors to ensure the health of growing species inside the greenhouse. The purpose of this project is to employ a low-cost and automated system using sensors and a micro-controller to monitor the greenhouse’s irrigation system and to send an alert if malfunctioning. The monitoring algorithm relies on the expected sharp increases of humidity levels when the irrigation is on. The algorithm developed to detect successful irrigation events requires three optimum value of parameters: the periodicity of the smoothing process, the size of the moving window when calculating the slope values from the humidity data, and the value of the low pass filter. After a 3-week period of measuring and testing the efficacy of the algorithm, the values obtained for the highest level of accuracy of the irrigation events detection were 32, 30, and 0.34 respectively. With these optimum values, the monitoring of the greenhouse’s irrigation system is implemented and triggers an automated email notification when abnormal or missing irrigation events occur. The collected humidity and temperature data are visualized through a Google Site.
Introduction
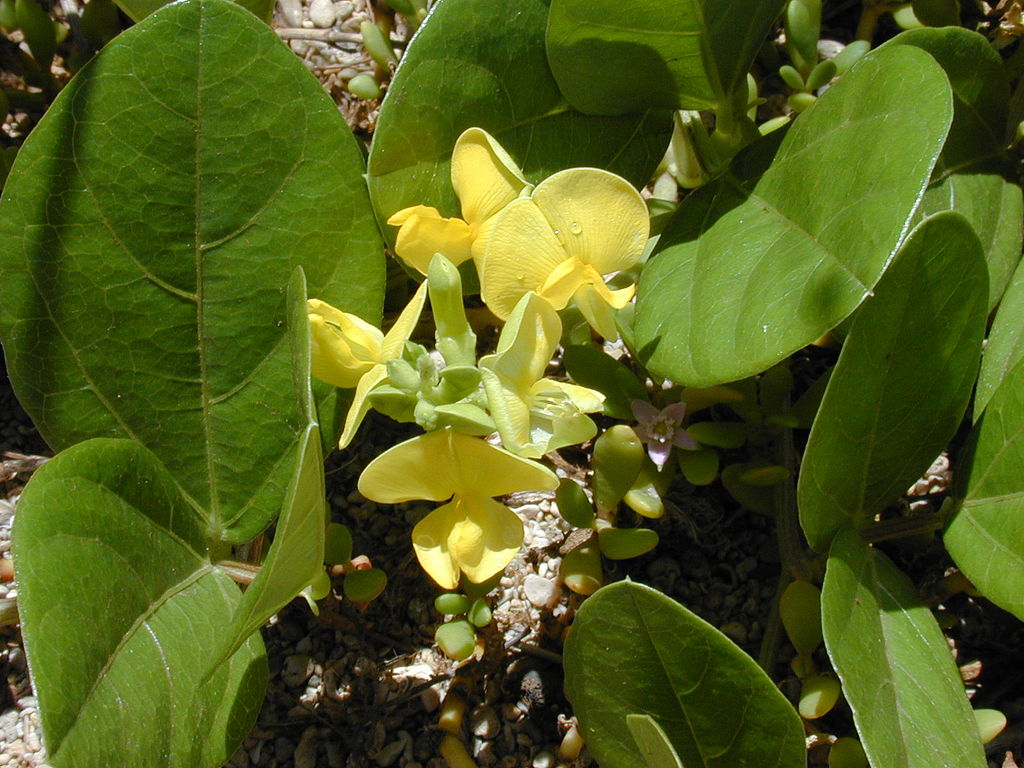
Native plants serve as the foundation for the biodiversity, health, and sustainability of the ecosystem. One of the more notable examples is their impact on coastal erosion in Honolulu, Hawai‘i. Beach studies conducted at the University of Hawaiʻi show that 10.7 miles of shore beach on the Oʻahu island that suffer chronic coastal erosion, has been narrowed by shoreline hardening, and 6.4 miles has been lost. This represents approximately 24 percent of the 71.6 miles of originally sandy shoreline on Oʻahu (Department of Land and Natural Resources, 2015). In coastal management, plants are considered to be a natural solution to the problem of erosion because their root systems anchor nearby sediment, increasing the mechanical strength of non-cohesive sediment. However, native flora has seen a gradual decline due to their sensitivity to climate shifts and the negative impact of agriculture, urban development, and introduced plants (Department of Earth Sciences at the University of Hawaiʻi at Mānoa, 2022). The Department of Land and Natural Resources stated in regards to Hawaiʻi’s coastal erosion management that there is a need for a “strong public outreach, education efforts, mitigation with an emphasis for efficiency and direct action” (Department of Land and Natural Resources, 2015). At Kapiʻolani Community College, classes in biology and the natural sciences promote sustainability through education and service-learning opportunities. The Vigna Marina, Sida Fallax, and Lycium Sandwicense–among others–are indigenous plants grown within the Kapi‘olani College greenhouse that could be used to supplement efforts against coastal and environmental erosion. These plants are able to survive in extreme climate conditions and their unique roots that are able to anchor in the ground and prosper, which in turn are characteristics that promote stability within the sediment (U.S. Department of the Interior, National Park Service, 2021). The underlying importance of growing, maintaining, and preserving of native plants and its history would promote sustainability, cultural understanding, appreciation and respect for Hawaiian history and culture as the science of botany fits symbiotically with Hawaiian culture because of its connection with medicinal use that is intrinsic to ceremonial practice.
The Koki‘o greenhouse at Kapi‘olani Community College is used to grow native and endemic plants for educational use in botany and biology laboratories in addition to propagation purposes across the campus grounds. To ensure successful growth of the plants, the greenhouse must maintain optimal conditions before their dissemination. A watering system is a critical component that must be monitored to ensure that the adequate amount of water is provided to sustain seedlings. Monitoring systems detect environmental changes that directly impact the quality of plants. An automatic monitoring system in the greenhouse is needed to reduce the need for in-person maintenance and water monitoring, especially during weekends.
Purpose
The purpose of this project is to create a notification system for the native Hawaiian plant greenhouse at Kapiʻolani Community College by collecting and analyzing humidity to detect watering events.
Methods
Experimental Setup
In this project, the following hardware have been used to build the monitoring system:
- Raspberry Pi 3 model B
- Temperature and humidity sensor
- Protective case
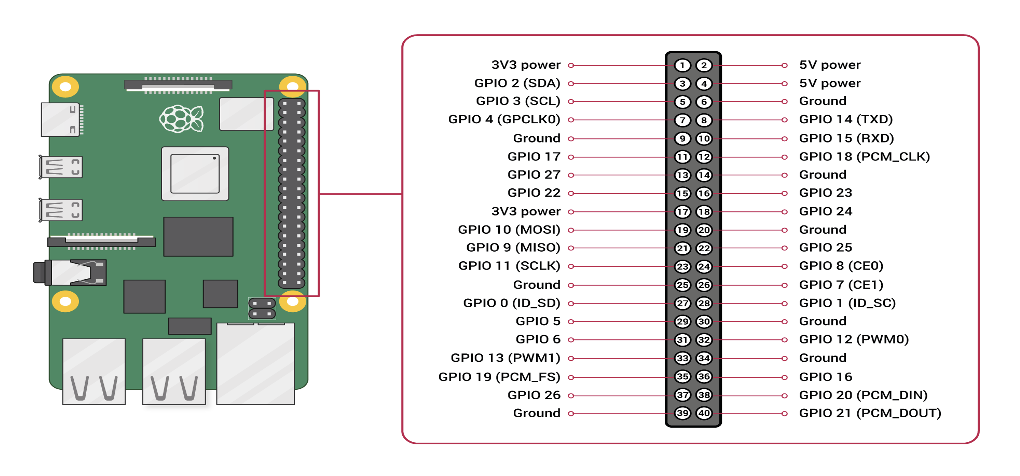
The Raspberry Pi 3 (figure 1) is a micro-controller that contains one central processing unit (CPU), one gigabyte of random access memory (RAM), and programmable input/output peripherals capabilities. It is small in size and only uses approximately 5 watts of power (Raspberry Pi, n.d.).

Shown in figure (2), the Raspberry Pi 3 (RPI) provides the use of a wide range of sensors that can be connected directly on the motherboard through a 40-pins general-purpose input/output (GPIO) header and can support general-purpose input/ouput (GPIO), inter-integrated circuit (I2C), serial peripheral interface bus (SPI), and universal asynchronous receiver/transmitter (UART) protocols. The 40-pin GPIO header provides the following types of pins: GPIO standard pins that can be used to turn devices on and off; I2C that allow you to connect and talk to hardware modules that support this protocol; SPI pins that can be used to connect and talk to SPI devices; UART serial pins used to communicate with other devices; power pins (3 and 5 Volts) to deliver power to sensors; and ground (GND) pins used to ground devices.
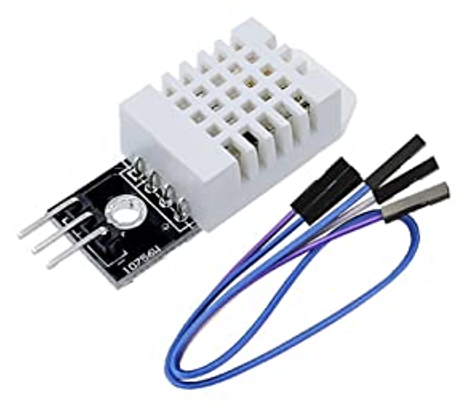
The temperature and humidity sensor used in this project is the DHT22 sensor. This sensor is able to measure temperature from -40 to 80 degree Celsius with an accuracy of: +/-5 degrees C and humidity from 0-100 relative humidity percentage with an accuracy of +/-2% As shown in figure (3), the DHT22 sensor requires three connections: power, data, and ground in order to operate (HiLetgo, n.d.).
The DHT22 humidity and temperature sensor was connected to GPIO pins of the Raspberry Pi 3 model B. For this sensor to be connected, it needs three pins to operate: one to process data, one for power, and one for ground. The DHT22 sensor uses connection 5V and could be connected to GPIO pin 2 or 4 pin; 2 was chosen. It also requires a ground provided by eight possible GPIO pins (6, 9, 14, 20, 25, 30, 34, and 39); pin 6 was chosen. Last, data needs to be transmitted from the sensor to the RPI using any of the 17 available standard input/output GPIO pins; GPIO pin 4 was arbitrarily chosen.
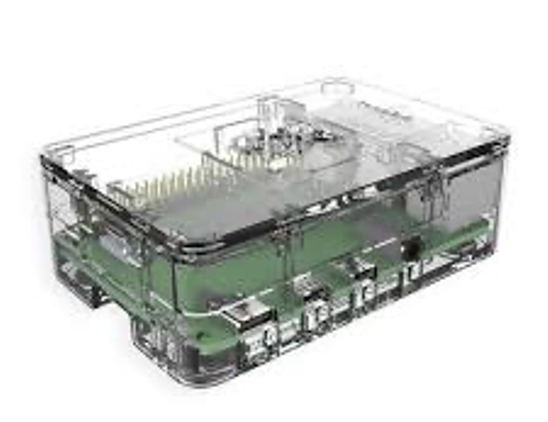
To protect the sensitive electronics from the surrounding environment (specifically extreme conditions from humidity and temperatures that would affect the hardware during watering events), a protective case was used as shown in figure (4).
Data measurement and visualization
After setting up the Raspberry Pi operating system and connecting the DHT22 sensor, shell scripting and Python and Perl languages were used to automate the data acquisition, visualization, and publication.
The DHT22 sensor is continuously measuring humidity and temperature data at a frequency of 0.14 Hertz (once every seven seconds). Each time data from the sensor is measured, it is saved on a CSV formatted file and tagged with a timestamp in EPOCH format. Through a cron job and GnuPlot, three graphs are automatically created every day at 11:50 pm and provide a humidity versus time graph, a temperature versus time graph, and both humidity and temperature versus time graphs. Apache, a free web server installed on the RPI, allows the data visualization to be accessible on the internet. With a static IP associated with the RPI, a Google Site is able to access, load, embed and display the state of the humidity and temperature of the greenhouse on the internet.
The next step, to provide a visual confirmation of the watering system that produces a short spike in the humidity graphs every time the watering system is turned on, is to provide an automatic detection system that would alert the faculty member in case the watering events are not or not taking place detected.
Detection Algorithm
The purpose of this algorithm is to establish a baseline of normal patterns and detect abnormal events. In this case, the short watering events within the greenhouse are vital to record. Indicators of such events is evident by a several-minutes drastic spike in the humidity data every time the watering system turns ON. These times were set by the watering timer of the greenhouse: 5:00 am, 9:00 am, 1:00 pm, and 3:00 pm.
The algorithm involves the execution of sequential steps using a 24-hours long time series of humidity data. Each day, the algorithm used the previous day’s data and done over a 3-week period in order to acquire enough data to validate its efficacy.
The algorithm includes the following steps:
1. Smoothing the data
2. Detect the spikes in the humidity times series corresponding to watering events
A. Calculate the slope value for a selected window of data points
B. Apply a low pass filter to identify high slope values at know watering times
Smoothing the data
Two moving average treatments were considered: exponential and simple average. An exponential moving average (EMA) is a moving average that places a greater significance on the latest data points in the time series and is best appropriate for sudden changes. The simple average algorithm (SMA) is better suited for slow changes and is not as sensitive to the last data point of the time series considered (Chen, 2022). The EMA was chosen for this project to capture the sudden increase of relative humidity. The equation used is as follows:
EMA = (C – P) * MF + P
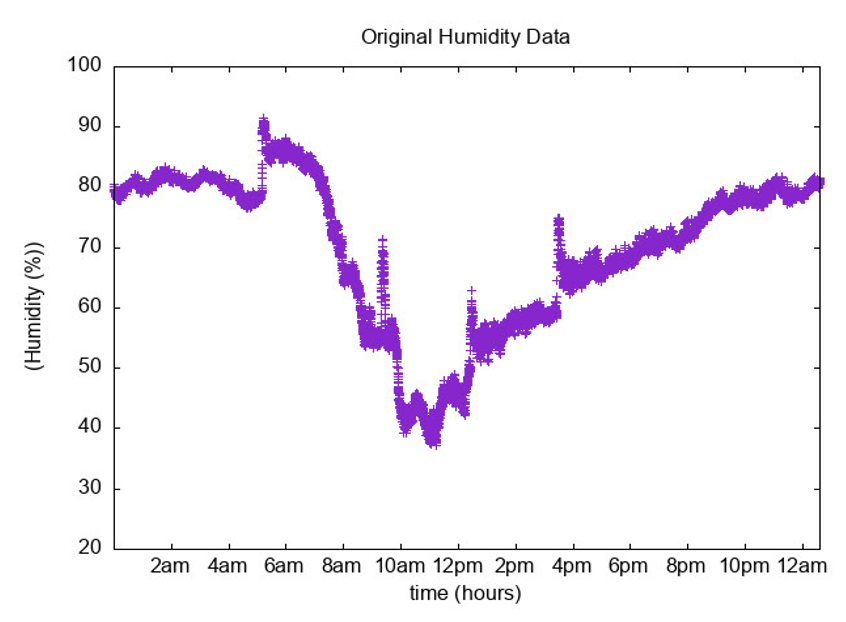
Where C is the current data point, P is the previous calculated EMA (simple moving average (SMA) for the first calculation in the time series), and MF is the multiplying factor defined as 2/(p + 1)where p is the periodicity. As seen in figure 5, the four spikes in the humidity data are visible on a 24-hour time series that has not been smooth and correspond to the four irrigation events.
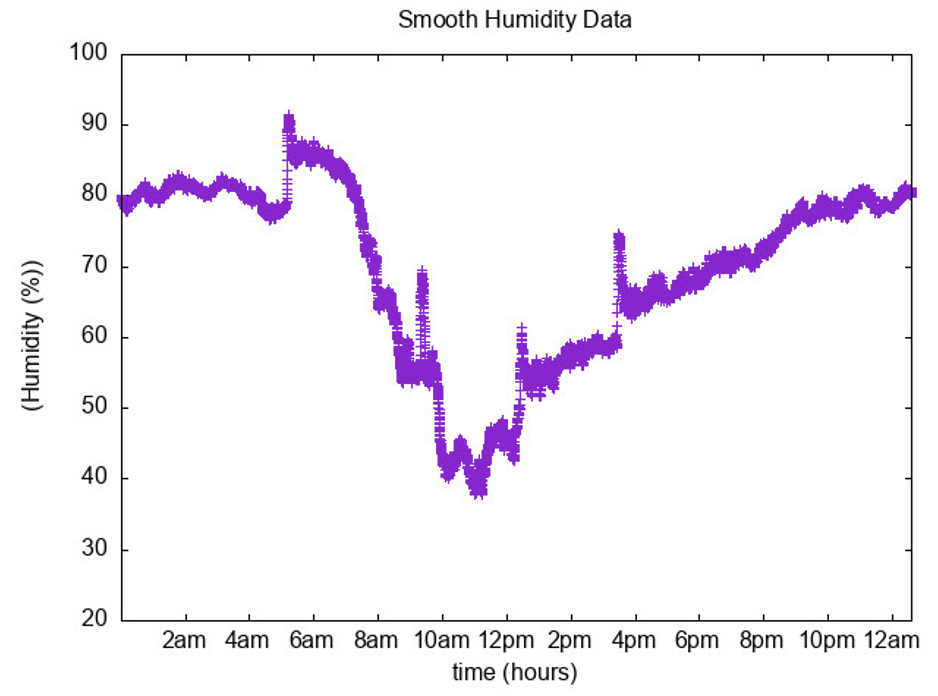
However, there are significant short-term fluctuations in the data that may cause the subsequent detection algorithm to fail (false positive). When the EMA is applied with a periodicity that is too low—for instance 5—as shown in figure 6, the smoothing treatment is not efficient enough to smooth the data appropriately, but the spike information is still present.
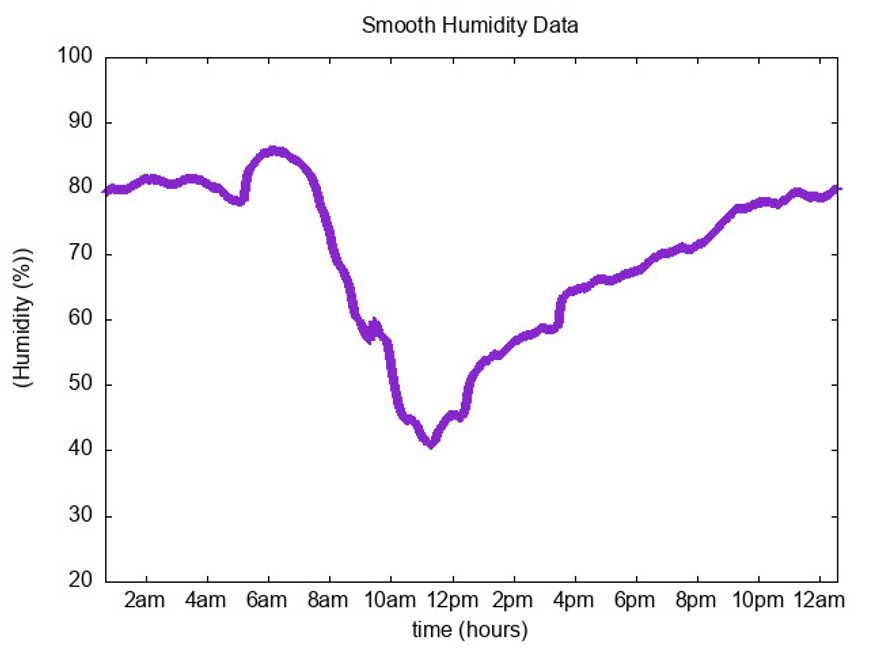
When the periodicity is chosen to a very high value such as 300 (figure 7) the small short term fluctuations are smoothed out. However, the smoothing process is too aggressive, causing information to be lost: the time series is very smooth, but some of the spikes disappear after treatment. Hence the need to test all possible values for p and find the optimum periodicity that would smooth the data appropriately—and yet not prevent loss of information—is necessary. The integer values of the periodicity p were selected between 5 and 50 and the EMA was calculated.
Slope calculation
The next step is to create a new time series by calculating the slope value for a window of N data points, move the window by one data point, recalculate the slope, and continue this process throughout the entire time series. When the slope values reveal a sudden spike, it is expected that the watering system is on. The formula used to calculate the slope m is:
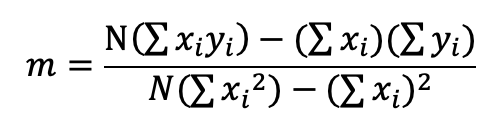
Where x is time, y is the humidity and N is the number of data points selected. The next challenge is to decide on the size of the window (the choice of N). Too small of a window causes the newly produced time series to have lots of fluctuations when calculating the slope and may lead to false positives. Similarly, too large a window would smooth the spikes and not produce a high enough slope value because of the excess amount of data points before and after the spikes would lower the slope value significantly. For this project, the integer values of the N number were selected between 5 and 30 data points since water events produced a peak of humidity that never exceed 30 data points before coming back to baseline. To complete the analysis, a low pass filter was applied to the new time series composed of slope values to detect accurate watering events. The purpose of such a filter is to ignore unnecessary values given certain parameters. In this case, the value of the cutoff slope f in the low pass filter treatment must be chosen such that the values of the slope exceed that cutoff limit when the four known watering events are taking place. If the value f of the filter is set too low, false positives are detected (detected events that did not actually occur). If f is chosen too high, the true positives may be lost (not all events are detected). The real (non-integer) values of the f number were selected between 0.06 and 0.40 data points with an increment of 0.02. An example of the low pass filter value process is shown below in figure 8.
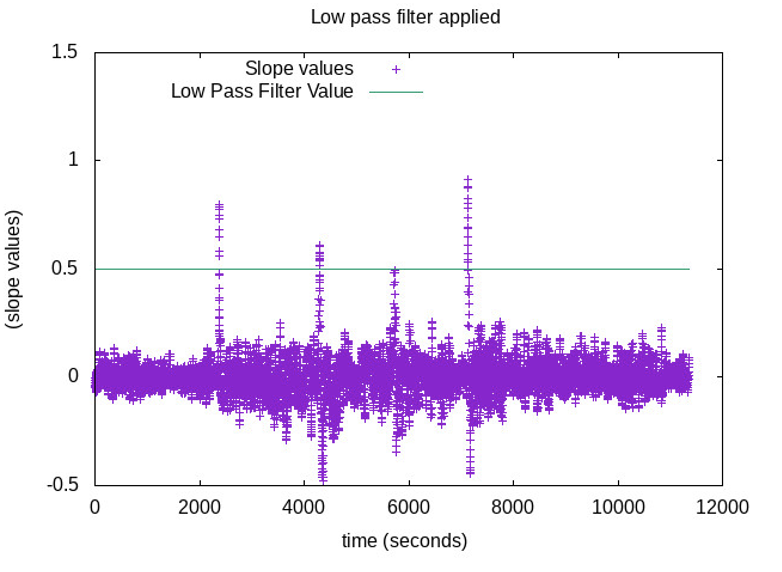
The above example shows that if the selected value of f is 0.5, all four events are detected. If a higher value than 0.5 was used, one event would be missed. Similarly, if a lower f value, multiple false positive events would have been detected.
The final step of the detection algorithm is to identify the optimum value for each of these three parameters: the periodicity p, the number of data points N, and the value of the low pass filter cutoff f. The number of possible p values is 47, of possible N values is 26, and the number of possible values for f is 18. The product of these three numbers showed to 21996 possibilities when applying the low pass filter cutoff to the time series of slope values. These calculations were done on a daily basis on an Intel CORE i3 processor using two hours of processing time. As the calculations proceeded through all 21996 possibilities, the algorithm would keep track of these three values every time the four scheduled irrigation events were detected successfully.
Results
After running the algorithm for twenty-one days, the three parameters p, N, and f were plotted in a three-dimensional graph. Each time the four events were detected, a weight value of 1 was assigned to the combination of p, N, and f, and increased by 1 each time the four events were detected on subsequent days for the same values. After three weeks of running the algorithm, the following graph (figure 9) was generated:
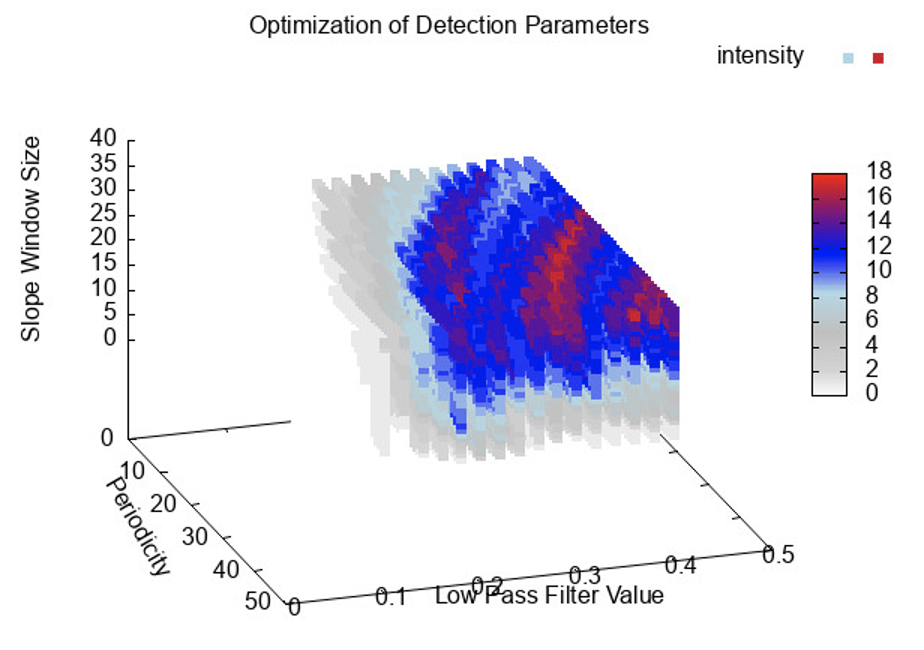
In the three-dimensional graph, the red data points represent the combination of p, N, and f for which the maximum amount of accurate event detection was done (17 times). The middle section (in red) of the graph represents the optimum range. The periodicity did not seem to be highly sensitive with its range from 28 to 38: both the number of data points and the low pass filter value were more sensitive and fell within a smaller range of 29 to 30 and 0.32 to 0.36, respectively. The optimum values for the periodicity p, number of data points used to calculate the slope values N, and the value of the low pass filter f were chosen to be: 32, 30, 0.34, respectively. These values were used to validate the detection on a daily basis.
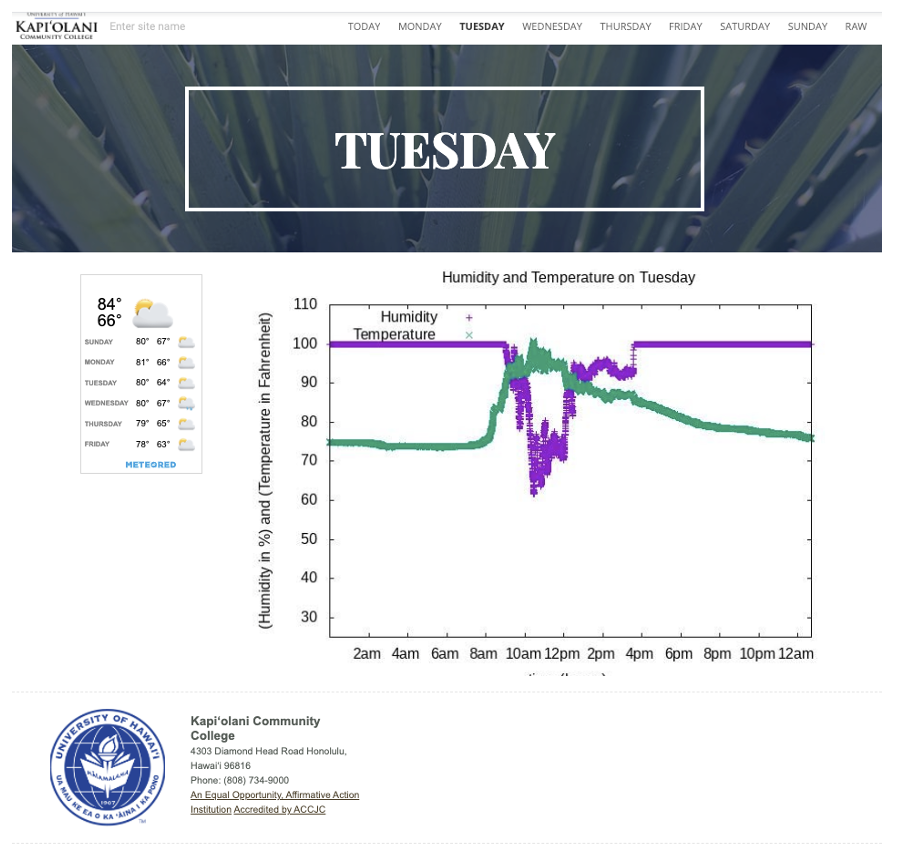
In addition, daily visualization of the data is available on a privately published Google Site (figure 10) where the user can view automatically updated plotted humidity and temperature graphs as well as download the raw data.
Finally, the last step is to employ a notification system that would detect abnormal watering within the greenhouse. With the optimum p, N and f parameters obtained after piloting the detection mechanism, the algorithm is executed every afternoon, and triggers an automated email to the botanist responsible for the greenhouse in the absence of humidity spikes detection at scheduled times throughout the day. This mechanism is accomplished on the RPI using a Perl script and a mail replay that relies on the college’s “Simple Mail Transfer Protocol Client” (SMTP) server that sends an email to the intended recipient indicating the missing events through a customized message.
Discussion and Further Research
During testing, raining events caused the humidity data to increase and plateau at 100 percent, which in turn would make the detection algorithm ineffective as the sharp increase of humidity due to the irrigation events would be no longer be present. This issue was observed during the development of the scripts but deemed minor due to the fact that rain seldom occurs in this area of Oahu, and that the trapped humidity would linger for many subsequent hours after the rain inside the greenhouse, providing moisture to the plants for long periods of time.
In future iterations, the different placement of the humidity sensor could enhance the accuracy of the irrigation event detection. They could be placed in small PVC cylinders placed directly under the sprinklers. As the irrigation algorithm is initiated, the sensor would be in direct contact with the falling water and produce a 100 percent increase in the humidity data, which would increase the detection of the event. Small holes would be added at the bottom of the cylinders to let the water drain over time.
Acknowledgments
Thank you to the following faculty and staff at Kapiʻolani Community College who made this project possible: the Center for Excellence in Learning (CELTT), Teaching and Technology at Kapiʻolani Community College; Assistant Professor Mike Ross, Botany, Math and Science Department; and Assistant Professor Jacob Tyler, Engineering, Math and Science Department. In addition, and foremost, I would like to thank the Kapiʻolani STEM program and their coordinators Li-Anne Delavega, Rachel Kaleimaile Galarita, and Joshua Faumuina for providing me with the opportunity to work on this project, and the Tribal Colleges and Universities Program from the National Science Foundation and Louis Stokes Alliances for Minority Participation (LSAMP) Bridges to Baccalaureate grant HRD 1619702 for funding this research.
References
Chen, J. (2022, March 18). Exponential Moving Average (EMA). Investopedia. https://www.investopedia.com/terms/e/ema.asp
Department of Earth Sciences at the University of Hawaii at Mānoa. (2022, May 18). MGeo Project Reports. https://www.soest.hawaii.edu/gg/academics/es\_mgeo\_project\_reports.html
Department of Land and Natural Resources. (2015). Hawaii Coastal Erosion Management Plan. https://climateadaptation.hawaii.gov/wp-content/uploads/2015/07/COEMAP1.pdf
DHT22/AM2302 Digital Temperature And Humidity Sensor Module. HiLetgo. (n.d.). Retrieved March 8, 2022, from http://www.hiletgo.com/ProductDetail/1952785.html
Raspberry Pi. (n.d.). Raspberry Pi 3 Model B. Retrieved March 8, 2022, from https://www.raspberrypi.com/products/raspberry-pi-3-model-b/
Sparkfun Electronics. GPIO board. Retrieved March 9, 2022, from https://cdn.sparkfun.com/assets/learn\_tutorials/1/5/9/5/GPIO.png
U.S. Department of the Interior, National Park Service (2021, June 22). Reducing erosion with native plants. https://www.nps.gov/articles/000/reducing-erosion-with-native-plants.htm
About the Author

Jenny Brown was born in Honolulu, Hawai‘i and attended Kapi‘olani Community College, where she pursued an associate degree in natural science with a focus in engineering. She is now completing her bachelor’s degree in electrical engineering at the University of Hawai’i at Manoa. Jenny values the collaboration and interdisciplinary aspects of engineering, and plans to use her education and work experience to improve the quality of life and foster sustainability within the community.
• • •
Enjoyed this story? Enter your email to receive notifications.
Aloha e Jenny Brown,
Great job enjoyed all your work. I own a Native Hawaiian Nursery in Kahaluʻu.
I am soooo happy that you recognize the importance of our Hawaiian Plants.
Holo mua!!!!