
Shannon Dunham, J.P. Holmes, and Jeremy E. Guinn
Environmental Science Department, United Tribes Technical College, Bismarck, ND 58504
Preface—
In fall 2012, students and faculty at United Tribes Technical College began to observe increasing signs of coyotes (Canis latrans) on campus. These observations included hearing howls and yips while shooting hoops on the basketball court in the evening, seeing tracks in the mud next to the door of classroom buildings, and watching a coyote hunt in the field outside through the ecology classroom window while class was in session. This spurred one student, Andrew Montriel (Turtle Mountain Band of Chippewa), into action. For his semester research project, he conducted a preliminary track study of coyote presence in public use areas around Bismarck and Mandan, North Dakota during spring 2013 and pushed for further study of urban coyotes in the area. His recommendations coincided with increasing coyote populations in state wildlife surveys (Tucker 2012) and led to the funding of a larger investigation that has become known as the UTTC Urban Coyote Study. Since then, more than 100 students have been involved in some aspect of the study and data has been incorporated into Problem-based Learning modules (AIHEC WIDER grant) at the college (NIH INBRE NARCH and NSF TCUP grant) and K-12 level (NSF RET grant), integrating research into the curriculum of several degree programs.

Introduction
Urban coyotes (Canis latrans) have been well-studied in major metropolitan areas such as Chicago (Gehrt 2006) and Los Angeles (Timm and Baker 2007). Recently, increasing populations, hybridizations between coyotes and domestic dogs, and perceived acclimatization to humans have resulted in more common urban coyote reports and increasing study of the species in urban areas across the country. Important insights into coyote behavior in large urban setting have been gained, however there is limited information concerning coyote activity in smaller urban zones surrounded by agriculture. Additionally, local and regional views on wildlife values impact the acceptability of wildlife (especially predators) in close proximity to human habitation. Bismarck has a population of just over 60,000 individuals and has grown more than 20% since in the past 15 years. The city limits encompass approximately 26.9 mi2. Greenspaces and natural drainages are common and while we use the term urban, Bismarck has very little of the concrete jungle that is found in major metropolitan areas. The purpose of this research was to examine coyote movement in order to identify gender differences in movement corridors from rural areas into the city and coyote resource use within the city limits. Building on previous study of coyotes’ wide use of Bismarck’s public areas (Montriel, unpubl. data), we hypothesized that coyote use would not favor a particular type of landcover types or city zoning parcel.
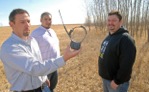
Students working on the project received training from our primary project partners, USDA APHIS/Wildlife Services office in Bismarck. The Wildlife Services team provided training, equipment, field time, advice, helped check traps on school breaks, and helped interpret the resulting movement maps. In addition, Wildlife Services hosted both A. Montriel and co-author J.P. Holmes for semester-long internships. Student researchers also received formal Responsible Conduct of Research training supported by the NSF REU and USDA NIFA programs.
Cultural Significance
While the coyote does not hold quite as significant a place in the culture of the northern plains tribes as it does for tribes of the Southwest, there are plenty of stories about coyote. He is often sly and witty, but Iktomi (in the form of a spider) is the primary trickster for northern tribes. Many coyote stories are not necessarily appropriate for children because his actions are routinely vulgar or less than admirable. Ranching culture brought a persecution of coyotes, along with other predators, to the northern plains, which continues today. Among urbanites, many enjoy a random siting of a coyote or hearing a few howls in the distance, while others are extremely disturbed by their presence in town and fear for their pets’ safety. This project provides baseline data for understanding coyote use of urban zones and movement corridors through the city to inform city planning and public safety if coyotes ever were to present a danger in the future. The broader project also seeks to determine ecosystem services provided by coyotes, including pressures exerted on herbivore pest populations.
Methods
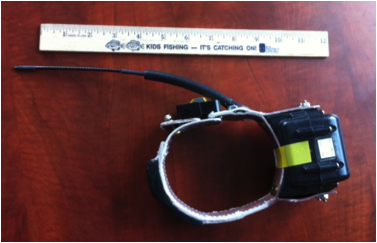
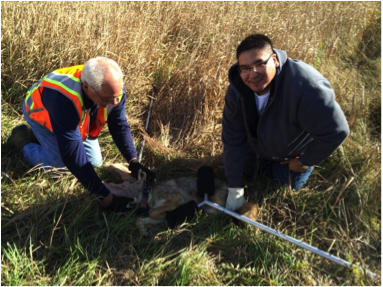
Coyotes were trapped in accessible and likely habitat within 3 miles of the border of the city on both public and private land. We trapped at various locations with approximately equal coverage on all quadrants of the city. We used modified leg-hold traps and cable restraint devices (Olson and Tischaefer 2004) and maintained a strict <24 hour trap check regimen. Iridium GPS Collars (425 g, G2110L Iridium LITE, Advanced Telemetry Systems, Isanti, MN) were attached and programmed to record four locations per day. The collars were fitted with an automatic drop-off device so that they would release from the animal at the end of the project. We used non-chemical (i.e. physical restraint) techniques to restrain coyotes, attach collars quickly, and release them with minimal stress.
Coyote locations were mapped using ArcGIS 10.2 and home range was determined using R-statistical software (R Core Team 2013) and Geospatial Modeling Environment (Spatial Ecology LLC, Ver. 7.2.1). We overlaid coyote locations with landcover and city zoning rasters (www.ND.gov/gis), using a chi-square test to compare ratios of coyote use to available habitat. We examined coyote location clusters using Spatial Analysis Kernel Density tools to determine areas of high-use and movement corridors. Differences in home range size based on gender were tested using a Student’s t-test.
Results
We tagged a total of 16 coyotes (8 male, 8 female) between November 2013 and October 2014. Coyotes were trapped in 12 of 16 trapping locations, providing coyote movement data within each quadrant of the city (NE, SE, NW, NE). More than 4,300 individual GPS locations were obtained and analyzed. The average home area of use was 12.68 mi2 (32.69 km2).
While several coyotes displayed a circular or oblong home range typical of most wildlife species, many coyotes in this study displayed unexpected movement patterns. Those coyotes used their core area, but had regular and often distant “exploratory” trips outside of the core area. The coyote would then return to its original core area, making these trips multiple times often to different locations.
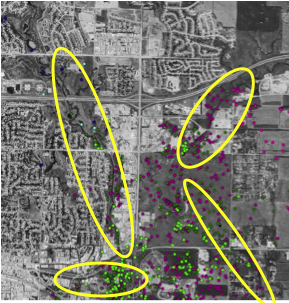
We were able to delineate the primary movement corridors for multiple coyotes (Image 4). The most important corridors allowing coyotes access to multiple locations within the city were drainages and the railroad track systems. Drainages, often associated with taller grass and cattails, provide not only cover for the coyotes to hide from humans, but also cover for prey animals, making them ideal foraging habitats. Two hundred seventy-nine locations occurred with 50 m of railroad tracks, with no difference between males and females. Railroad tracks and walking paths provide a path of least resistance which facilitates coyote movement for hunting and travelling from one area to another.
Gender Differences
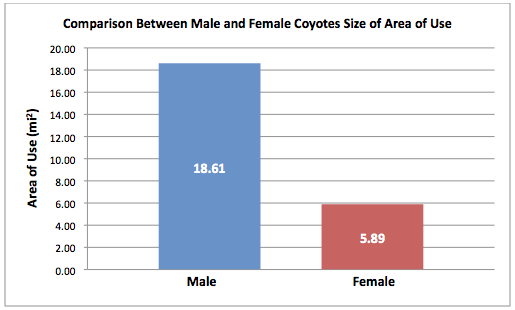
An equal number of male and female coyotes were tagged, however one female coyote’s transmitter failed within hours of being of deployed. Male coyote (N = 8) average area of use was 18.61 mi 2 (48.20 km2), while female coyotes (N = 7) averaged 5.89 mi2 (15.26 km2) (Fig. 1). Two male coyotes skewed this average by having extremely large areas of use of 62.27 mi2 and 59.25 mi2. Male coyote area of use ranged from a maximum of 63.27 mi2 to a minimum of 2.04 mi2. Female coyote area of use ranged from a maximum of 13.86 mi2 to minimum of 1.99 mi2.
Coyotes used different landuse types disproportionately to what was available on the landscape (Table 1) (c2, P<0.00001). Cultivated Crops, Hay/Pasture lands, Public Use areas, and Wetlands were used more often than would be expected by their availability, while Developed Areas were used less often than what was available. Developed areas, which make up more than 30% of the land area, were used sparingly (2% of locations) by coyotes in this study.
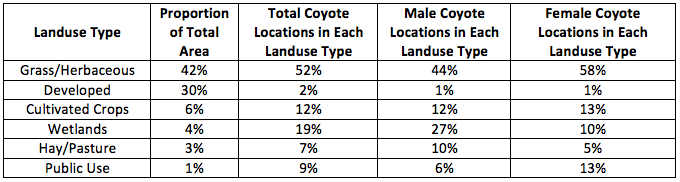
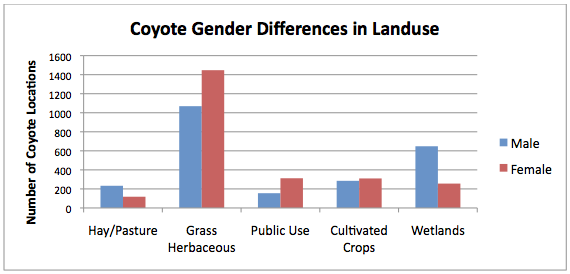
There were small differences between male and female use of landuse types (Fig. 2). Males were located in wetland habitat 27% of the time, while only 10% of female locations were from this habitat type. Similarly, females were located in Public Use areas 13% of the time, while males were only observed in those areas 6% of the time. However the difference in landuse by gender was not significant (t-test, 1-tailed P = 0.50). Both genders commonly used Grass/Herbaceous areas, which was the most common habitat available.
Non-target Catches
Very few non-target catches were made during this study. The list of non-target catches includes skunks (3), badgers (2), porcupines (3), red fox (1), stray domestic dog (1), feral cat (2), white-tailed deer (5), raccoon (2), jackrabbit (2), and cottontail (1) were caught and released. This short list was encouraging as we anticipated more domestic dog catches, as we were trapping within city limits. Our use of best practices to safely and selectively trap for coyotes paid off during this study.
Discussion
Initial trends suggest that coyotes use grasslands, wetlands, agricultural fields, and public use areas more often relative to the amount of those habitats available. Many of these areas provide high prey densities, relative freedom from persecution and shooting of coyotes and prey, and ample denning options. Coyotes were trapped or visually observed in 15 of 16 trapping locations, supporting Montriel and Guinn’s (unpubl. data) findings that coyote use of the city is widespread and common. Only two coyotes tagged during this study traveled more than 3 miles from the border of the city.
The impact of development in the city (resulting in part due to the Bakken Oil Boom) on coyote activities cannot be denied. Short-term increases in coyote activity in newly disturbed areas have been observed as prey animals are initially displaced. However, long-term use of the same area declines as housing-unit density increases. Coyotes avoided developed areas in this study. Coyote locations were frequently observed in close proximity (<10 m) to houses in subdivisions with >1 acre (0.405 ha) lots. Several locations came from <5 m from a house. However, coyote locations were rarely observed within subdivisions with <1 acre lots, as coyotes utilize the fringes of these neighborhoods rather than infiltrating into the core of the subdivision.
Gender plays a role in the dispersal of young animals, use of home range, and the maintenance of territory borders for many species. This project provides a foundation for better understanding the species use of a small city surrounded by agriculture and helps explain recent populations increases in urban areas. Gender differences in areas of use and corridors may provide key information in understanding territory boundaries. Current projects (Alkhafaji and Guinn, unpubl.) are examining diets of coyote in different zones of the city compared to their rural counterparts. We are also attempting to use scat DNA analyses to identify individual coyotes and their closest relatives to develop family-group territory/home range maps. These two summer projects will be expanded into long-term investigations of seasonal prey differences. Further analysis of existing data is also under way (Dunham and Guinn, unpubl.) and will provide information regarding potential den locations, seasonal differences, and diurnal activities.
An opportunity for future research is to examine the role of human dimensions on populations of coyotes and other predators in urban settings. The level of acceptability of these species to North Dakota urbanites is likely to be much different than in other areas of the country. Local and regional community values influence urban coyote populations, management techniques, and general acceptance of predators (Whittaker et al. 2006). Coyotes, sometimes called the nation’s most adaptable predator, have found a way to thrive in areas close to human habitation. Is it possible to find a way to co-exist with coyotes in the neighborhood?
Literature Cited
Gehrt, S. D. 2006. Urban Coyote Ecology and Management: The Cook County, Illinois, Coyote Project. Bulletin 929. School of Environment and Natural Resources. Ohio State University. 32pp.
Olson, J.F. and R. Tischaefer. 2004. Cable restraints in Wisconsin: A Guide to Responsible Use. Wisconsin Department of Natural Resources. Madison, WI PUB-WM-443.
R Core Team. 2013. R: A language and environment for statistical computing. R Foundation for Statistical Computing, Vienna, Austria. ISBN 3-900051-07-0. http://www.R-project.org
Timm, R.M. and R.O. Baker. 2007. A History of Urban Coyote Problems. IN D.L. Nolte, W.M. Arjo, D.H. Stalman (eds.). Proceedings of the 12th Wildlife Damage Management Conference:272-286.
Tucker, S.A. 2012. North Dakota Furbearer Status Report-2012 Midwest Furbearer Workshop. Available http://www.motws.org/MWFBWS/StateReports%5CND_FurbearerStatusReport_Midwest_2012.pdf. Accessed 5/10/13.
Whittaker, D. J.J. Vaske, and M.J. Manfredo. 2006. Specificity and the Cognitive Hierarchy: Value Orientations and the Acceptability of Urban Wildlife Management. Society & Natural Resources 19(6):515-530.
Acknowledgements
USDA Wildlife Services: John Paulson, Phil Mastrangelo, Jeremy Duckwitz, Brent Ternes, Ryan Powers
ND Fur Hunters and Trappers Association: Rick Tischaefer
ND Game & Fish Department: Stephanie Tucker
Landowners and Managers
NASA & National Science Foundation
GIS: Joe Martinetti, UTTC
Student Technicians: Andrew Montriel, Shannon Dunham, JP Holmes