
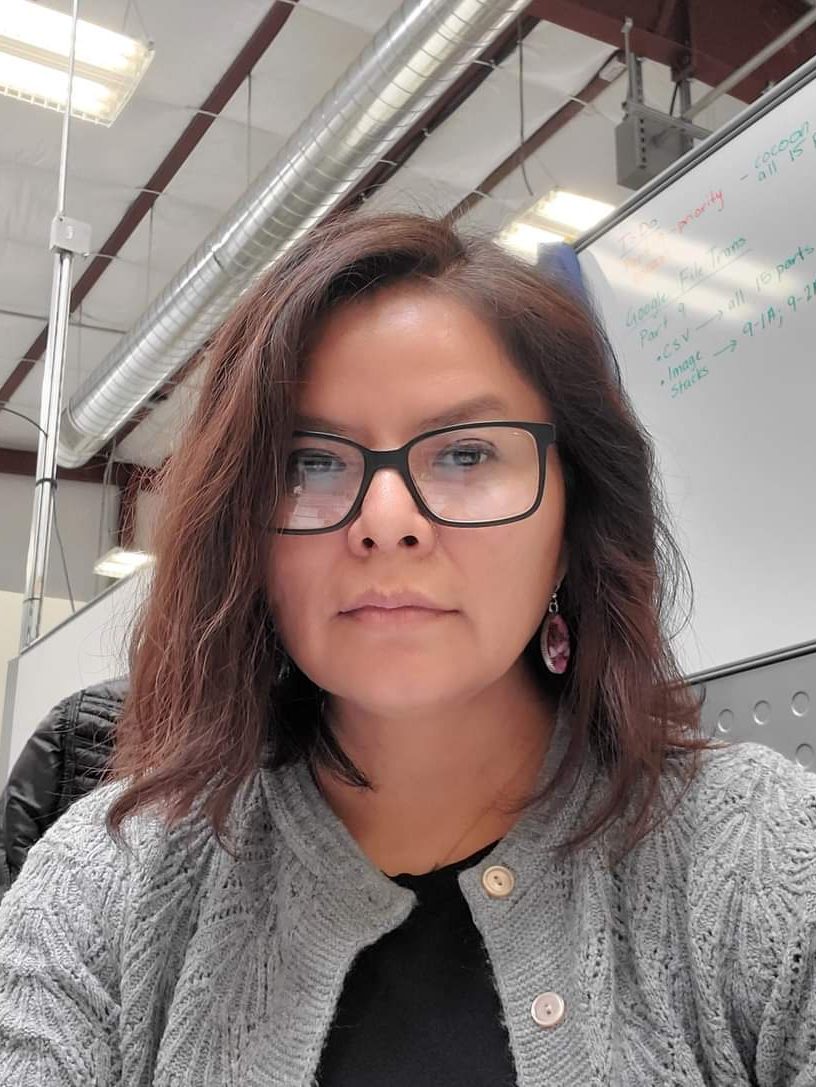
By Marcie Vandever
Introduction
By Scott Halliday
Director, Center for Digital Technologies Navajo Technical University
The Navajo Nation is the largest Native American tribe in the Western hemisphere despite attempts of acculturation and assimilation that included the Long Walk of the Navajo, boarding school education, and countless federal policies that sought to erase identity and detach Diné from the land they hold sacred. This has been possible by the Diné people’s ability to adapt while improving on existing processes and making them their own.
The gift of adaptability was taught to the Diné at time of emergence and was essential to early survival. When sheep and other livestock were introduced through Western expansion, Diné were able to use the animals for food sources and to help improve land for agricultural purposes. Sheep, in particular, would prove essential as Diné people would take the knowledge learned from the deity Spider Woman to take the wool of the sheep to create clothing, shelter, and intricate rugs that allowed the Diné people to progress into modern times.
Today, Diné people have used their ability to adapt to various fields of study, including engineering, science, and technology. Education has been the driver of self-determination on the Navajo Nation as higher education institutions like Navajo Technical University (NTU) have emerged pushing new industries such as advanced manufacturing.
NTU has been building infrastructure to support metal Additive Manufacturing (metal AM) on the Navajo Nation and within the US through NSF TCUP funding to develop a Center for Advanced Manufacturing (CAM). This drive towards developing metal advanced manufacturing (AM) on the Navajo Nation was requested by the Navajo Nation in 2018 to help drive economic development and was included in the Navajo Nation’s economic development plan.
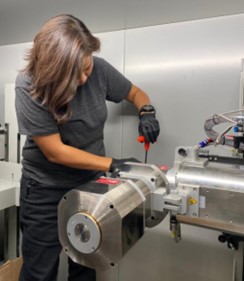
The project is a multiyear endeavor which includes procuring the proper equipment to support metal AM, train students in the technologies needed for metal AM, develop a competent staff of recent graduates who can perform the necessary technical work needed for metal AM and research, and finally, create spin off companies to address local and regional metal AM needs. Marcie Vandever, a junior in the Advanced Manufacturing Technology program, completed the first comprehensive metal AM research project for her capstone course advised by Dr. Ragavanantham Shanmugam and Dr. Monsuru Ramoni. Marcie has worked at the CAM for two years and has been involved in material testing using an Instron tensile tester incorporating an ARAMIS digital Imaging Correlation (DIC) system to capture deformation data and record the test using high speed cameras in 3D. Marcie has also received extensive training using the North Star Imaging X3000 CT scanner to validate part quality through porosity studies. She also has a working knowledge of the other areas within the lab which includes the metal AM Optomec Direct Energy Deposition (DED) machine, the Electric Discharge Machining (EDM) machine, microscopy, and Computer Aided Design (CAD).
Marcie’s project took her through the whole metal AM ecosystem: 1. Pre-processing (CAD, simulation, powder analysis, etc.); 2. Processing (build parameter settings – laser power, hatch spacing, layer thickness, etc.); 3. Post-processing (machining, heat treatment, etc.); and 4. Validation (inspection, CT scanning, material testing, microscopy, etc.).
Marcie has demonstrated that through funding provided by NSF, NASA, NNSA and others, TCU students can conduct high level research on par with any major university in the US. She is currently working as an intern for Sandia National Laboratories in Albuquerque, NM and is interested in furthering her knowledge in material science. NTU has built an ecosystem around additive manufacturing that will allow for sustainable growth into the future that will be supported by students like Marcie Vandever.
Marcie’s research was supported by the NTU Center of Advanced Manufacturing staff, Gregory Dodge, Eric Bailey, Adriane Tenequer and Shane Tsosie, all NTU graduates as well as Joshua Toddy for metal AM operations who is a senior at NTU. Partnerships on research projects with Drexel University, University of Nebraska – Lincoln, New Mexico State University and Sigma Labs, LLC also provided valuable experience for Marcie and the CAM staff to increase competency in the metal AM ecosystem.
• • •
The Comparison of Microstructure and Mechanical Behavior of Stainless Steel 316L Using Near Net Shaped and Fully Embedded Methodologies Using DED Metal Advanced Manufacturing
By Marcie Vandever
The purpose of this research was to determine whether there was a difference in microstructure and mechanical behavior using [?] near net shaped and fully embedded manufacturing extraction techniques of stainless steel 316L. Findings will help determine if two different manufacturing extraction methodologies of a 3D printed stainless steel part will affect the overall performance of test specimens. Research will implement advanced manufacturing, part designing, part modeling, CT scanning, porosity analysis, part simulation, material characterization, and material testing. This research will also address the amount of time, production, strength, composition, and overall performance of SS 316L printed material.
Printing of parts was completed using an Optomec Lens 3D Hybrid metal AM machine. Near net shaped printing methods have a closer tolerance of material around the part gauge length area. This style of printing adds an additional 2-3 mm of material to the gauge length area. Cocoon style printing adds more tolerance around the sample’s gauge length area. This style of printing allows the part to cool slower, adding an extra 5-6 mm of material to the gauge length area. This should lead to a difference of microstructure which will influence the mechanical properties of the test specimen. It is my hypothesis that the faster cooling near net shaped specimen will have a higher tensile strength and lower elongation, while the slower cooling cocoon build specimen will have a lower tensile strength and a higher elongation. Stainless Steel 316L is corrosive resistant, has good weldability and heat resistance. It is chemically resistant and widely available. Powders used for this research had an ingredient composition of iron, chromium, nickel, molybdenum, silicone metal, and manganese. The diameter size of the metal powders ranged in size from 45 – 150 microns. They have a metallic appearance and a melting point of 1770-1900 degrees Fahrenheit. Metal powder weight compositions are iron > 50%, chromium 10-25%, nickel 10-25%, molybdenum 2.5-3%, silicon metal 1-2.5%, manganese 0.1-1%. Exact powder composition weights are held as trade secrets by the manufacturer.
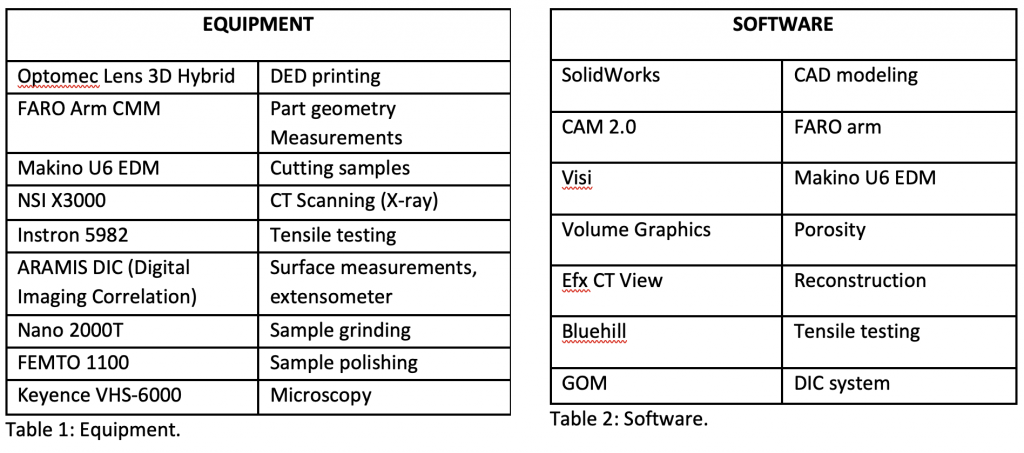
The additive manufacturing printing process was completed using an Optomec Lens 3D Hybrid metal printer. The Optomec printer has four powder nozzles, two powder feeders, an infrared light laser, and prints within a controlled atmosphere with argon gas. A prototype part was printed using the printing parameters with 315W of power, a laser speed of 20 in/min., hatch spacing of 0.012 inches, and a print time of 80 minutes to print one mini Tensile test sample, often referred to as a “dog bone.” Printing parameters used to print test samples for the research were a laser power of 300W, hatch spacing of 0.015 mm, layer resolution of 0.015 mm. at a speed of 20in./min. on a 1-inch SS build plate.
A FARO Arm CMM, or coordinate measuring machine, was used to collect part dimensions and measurements from printed builds. The FARO arm was used to verify the parts geometry in reference to its position to the build plate with its CAM 2.0 software. An origin was created and placed with the best starting location for setup in the electric discharge machine (EDM). The origin would be the (0,0) location when exporting the .iges file from CAM 2.0 to the SolidWorks CAD software. Exporting the .iges file allowed the dimensions collected from the part to be used to reverse engineer the part with the collected measurements.
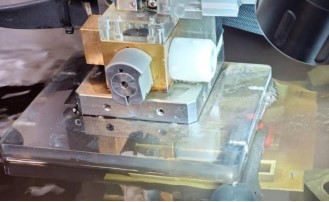
A Makino U6 EDM was used to perform extraction methods of part samples. The EDM utilizes a copper wire that is 0.2 mm in diameter that was factored into the modeling and designing of the CAD models. Part geometry measurements were collected using the FARO Arm and saved as an .iges file. The .iges file was uploaded into SolidWorks and converted into a CAD model that creates lines to be used for the .dxf. file. A .dxf file is a drawing exchange file extension that is used for importing and exporting CAD files for EDM machines. File transfers were emailed to the machinist uploading it to their VISI software. The Makino U6 EDM has maintenance requirements that need to be met before it will allow cutting to start. EDM setup took up to one hour to mount the build plate in alignment with the orientation of the (0,0) x and y axis created with the VISI software. This (0,0) axis is the location in reference to the EDM work-envelope, this is where the EDM starts the profile cuts to be completed.
A North Star Imaging (NSI) X3000 computed tomography machine was used to perform non-destructive image analysis of the internal and external print qualities of samples. CT scanning was performed on 24 test samples, 12 to be used for tensile testing and 12 for material surface characterization. Radiographs were reconstructed with the use of the NSI Efx CT software. The Efx CT software provides 2D and 3D views of scans and allows the operator to remove noise from radiographs. Before scanning samples, maintenance needs to be performed on the x-ray head followed by a start-up procedure using a beam blocker to warm up the machine before scanning.
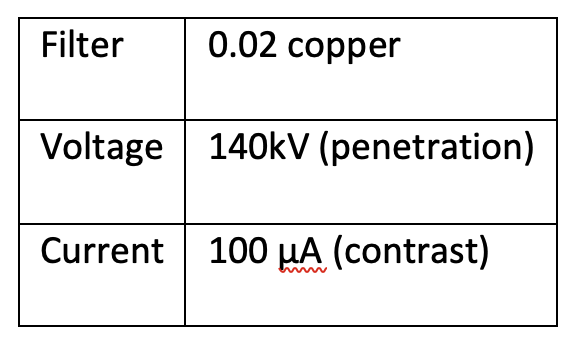
Scan setup requires setting the part on the scan table with fixtures to hold the part in place. The x-ray is turned on with the table rotating in increments of degrees. The voltage and current are input and adjusted to gain enough power to penetrate through the thickest section of the part. The first scan is used to set the scan parameters and gains for the rest of the scans. Gains will adjust contrasting, penetration, noise, and pixels within the radiographs. Scan parameters used for this research were:
Efx CT software was used to reconstruct the radiographs of samples. Steps that were completed for reconstruction are auto-contrasting, beam hardening, referencing, and reconstruction. All samples need x-rays reconstructed before uploading the NSI file into Volume Graphics for porosity analysis.
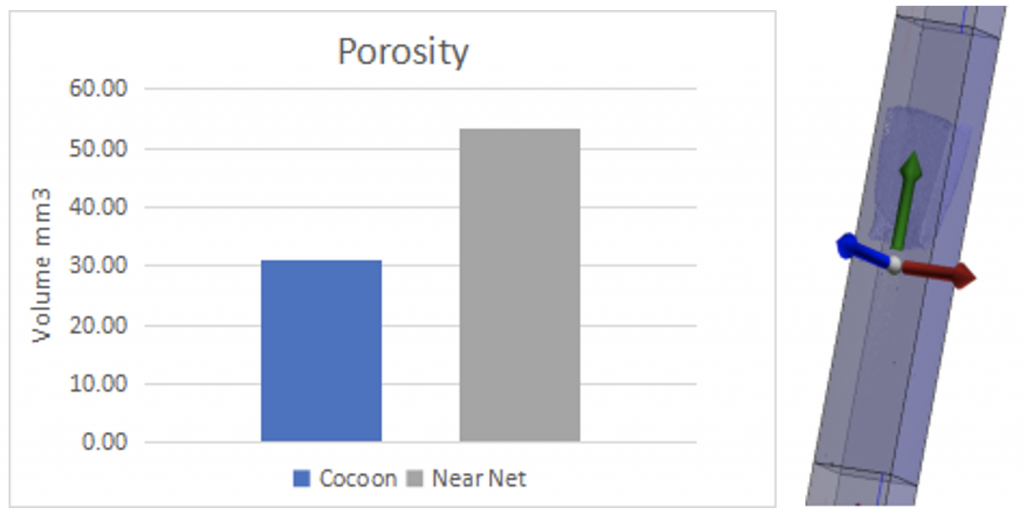
Porosity analysis was performed using Volume Graphics software. An NSI file of each sample was imported into the Volume Graphics software. A surface determination was created for each sample and a porosity analysis completed. Porosity volume diameter was set to a 2.00 mm per 3 mm diameter. Porosity volume was analyzed within the 25 mm gauge length area of all samples. Porosity levels were calculated overall between cocoon and near net shaped samples. Near net samples showed to have higher levels of porosity within the 25 mm gauge length areas than the cocoon printed samples.
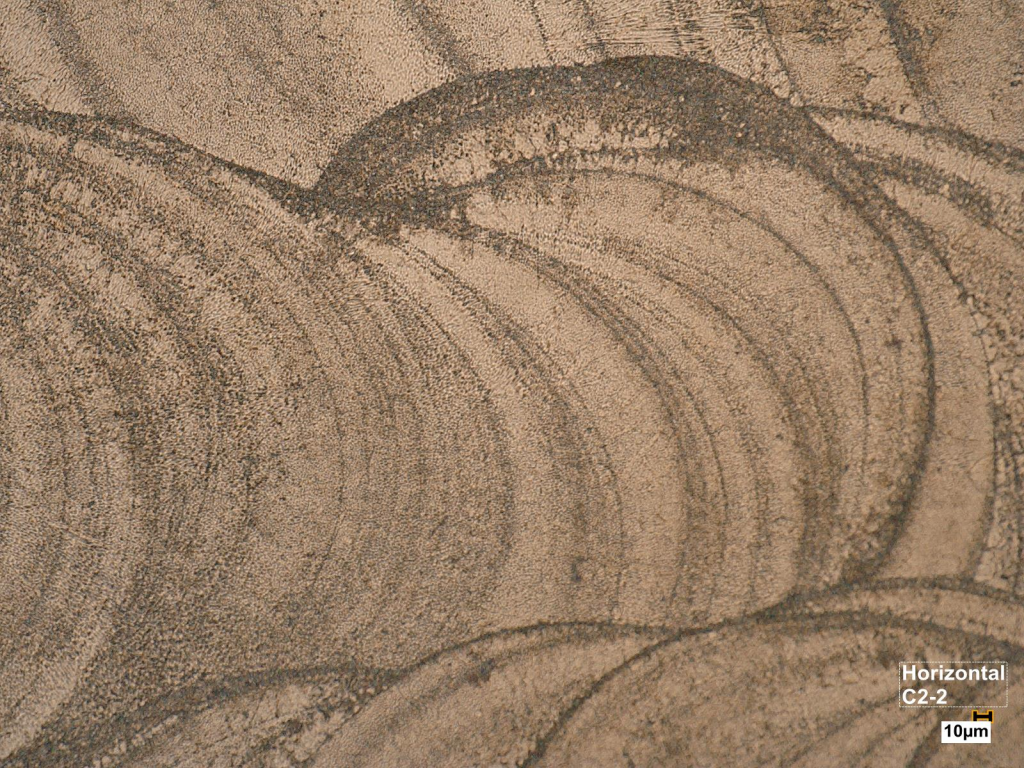
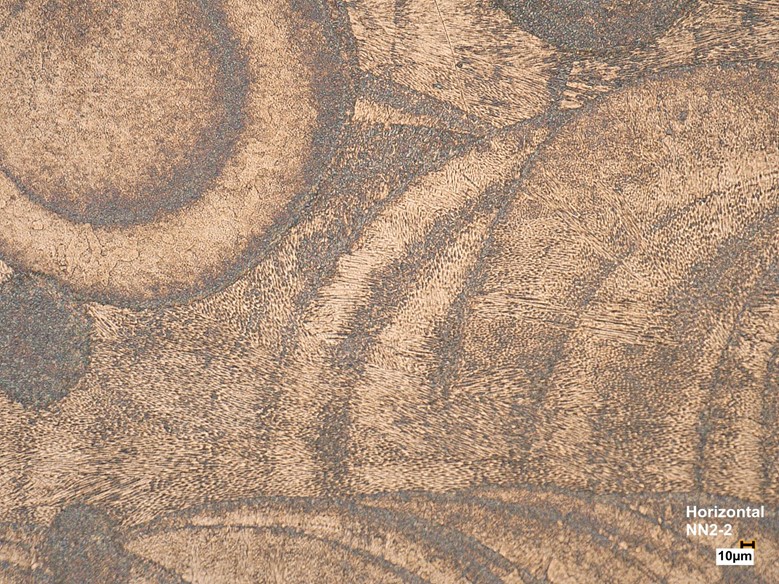
Surface characterization was performed to observe the microstructure on the surface of samples. Sample gauge lengths were measured and cut. The mounting ram has a 1.25-inch diameter that requires calculation of gauge length cuts to be made of samples. Considering the epoxy powders to be added to hold samples, gauge lengths were measured at 1-inch lengths. This allowed samples to be held within the epoxy mounting material. Deburring was necessary to remove burrs caused by the EDM cutting process to allow samples to sit evenly on the mounting ram. Grinding, polishing and etching allowed the surface crystal structures to be inspected under the 3D Keyence optical microscope. Laser path directions were inspected, hatch diameters and spacing were measured. Surface characteristics that were documented were cooling patterns, heat affected zones (HAZ), laser travel directions, and unmelted powders. Cooling patterns were visually noticeable under the 3D microscope with the near net shaped printed samples.
An Aramis Digital Imaging Correlation system was used to take surface measurements with full view analysis of changes made during testing. The Aramis DIC system requires calibration before being used during tests. A 100 mm calibration board was used to calibrate the system. The first calibration of the DIC system took three hours with no success of calibration. A second calibration was performed within 1 hour with a 0.050 pixel deviation. Speckling was required due to samples being of metal material. Speckling of parts requires a light base coat and dark speckle pattern with speckle sizes needing to be three to five pixels in diameter. Too many white or too many black spots will cause the DIC system to see that part of the surface of the material as an invisible or blind spot. Speckle sizes are determined by the width of the part.
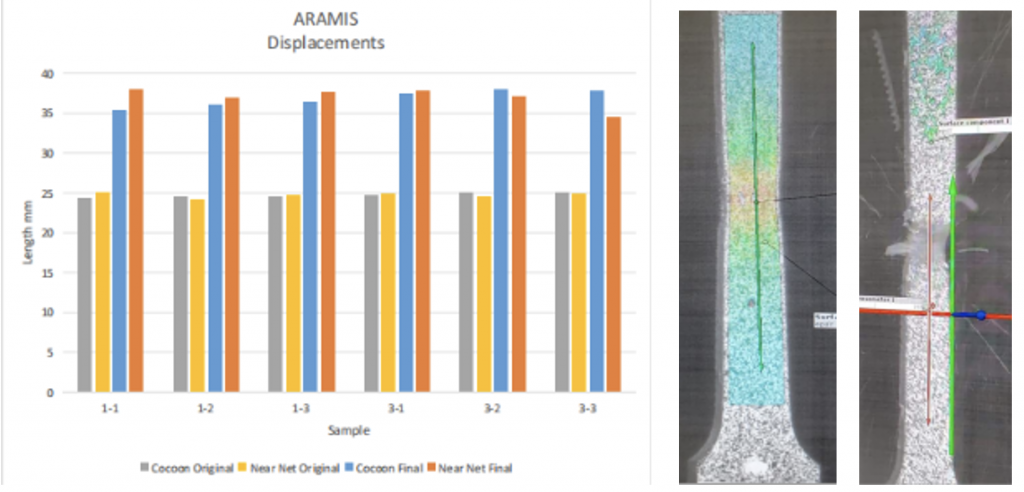
Material testing of samples were performed on the Instron 5982 Tensile Machine. The Aramis DIC System or digital imaging correlation system was used to take surface measurements of samples, and used as a digital extensometer while tensile testing was performed.
Tensile testing was set to be measured in MPa, with a 2% offset. The modulus of elasticity of sample NN3-3 was noticeably higher than all other samples. This higher level of modulus of elasticity was due to the thickness of the part being thinner than other samples. The nominal thickness of samples was 3.00 mm in thickness. Sample NN3-3 had a thickness of 1.89 mm resulting in the higher modulus of elasticity results.
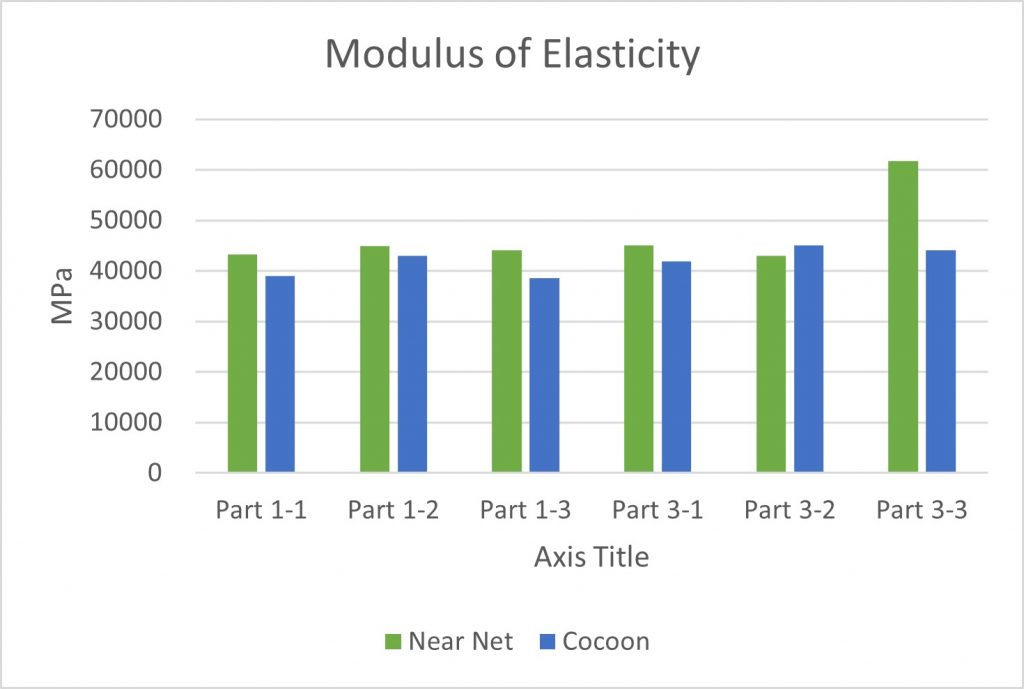
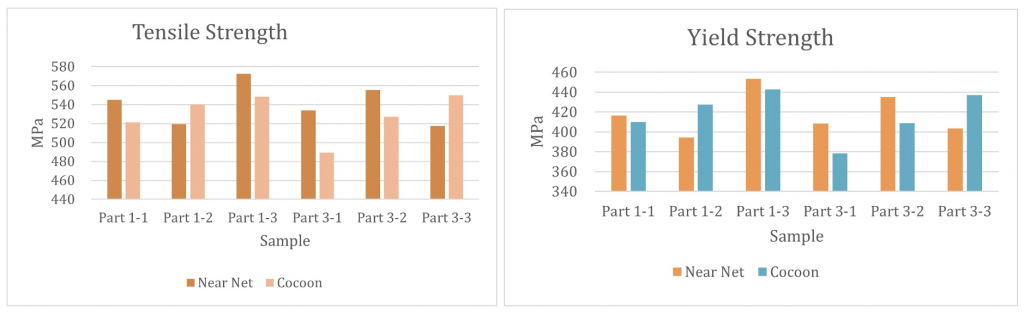
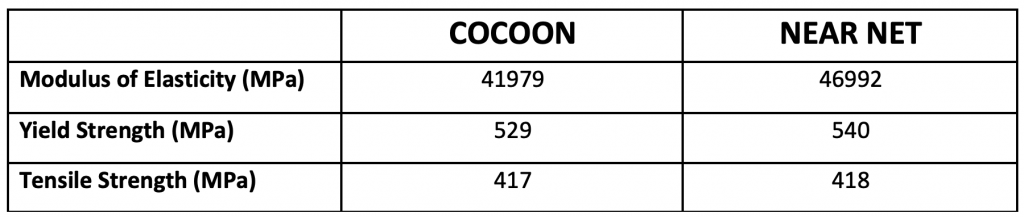
Test results showed the total modulus of elasticity of cocoon printed samples to be 41979 MPa, and near net shaped samples to be 46992 MPa. The total yield strength for cocoon printed samples was 529 MPa, and near net shaped samples was 540 MPa. The total tensile strength for cocoon printed samples was 417 MPa, and near net shaped samples was 418 MPa. The conclusion of test results shows the near net shaped printed samples had higher modulus of elasticity, higher yield strength and higher tensile strength.
Acknowledgments: Eric Bailey, Gregory Dodge, Harold Halliday, Adriane Tenequer, Joshua Toddy, Shane Tsosie and Ziyad Smoqi
Paper published January 20, 2022.
• • •
Enjoyed this story? Enter your email to receive notifications.