
By Tanner Veo, Gurjot S. Dhaliwal, Mandy Guinn, Ram Krishna Hona
United Tribes Technical College
Abstract
Different varieties of apples contain different amounts of iron. If someone is on iron supplement or in need of iron supplement, the knowledge of iron content in different apples can help them to select the most desirable variety. With this goal in mind, we made a comparative study of iron content in apples available in the Bismarck, North Dakota area. The iron extraction was accomplished by burning the edible part of each apple at 600 °C to produce white ash and dissolving the ash in concentrated HNO3. Spectrophotometric (colorimetric) analysis was performed to analyze the iron amount by the reaction between Fe3+ and SCN– ions. The study shows that Gala apples and Ambrosia Gold apples possess the lowest and the highest iron contents, respectively in the same mass of apples.
Introduction
Iron is one of the essential trace elements required for the human body. It remains an important constituent of the blood and tissues. About 70% of iron is present in the body as hemoglobin and the remaining as ferritin and transferrin.[1] Iron plays an important role in the transport and storage of oxygen. It also helps in electron transport through the redox process in the human body.[2] Iron has been used for well-established clinical therapies, such as the prevention and treatment of iron deficiency called anemia.
A biologically essential trace element, iron, can be received by our body through different foods, such as meat, vegetables, and fruits. The amount of iron that can be obtained from different kinds of fruit is usually generalized. For example, if someone Googles the iron content in an apple, s/he finds that the average iron content in a medium apple is 0.11 mg or 0.12 mg per 100 g of apple. But different kinds of apples contain different amounts of iron. This article aims at identifying the iron content of specific apple’ varieties, allowing consumers to select apple with the desired amount of iron.
Experiments
Preparation of sample solutions
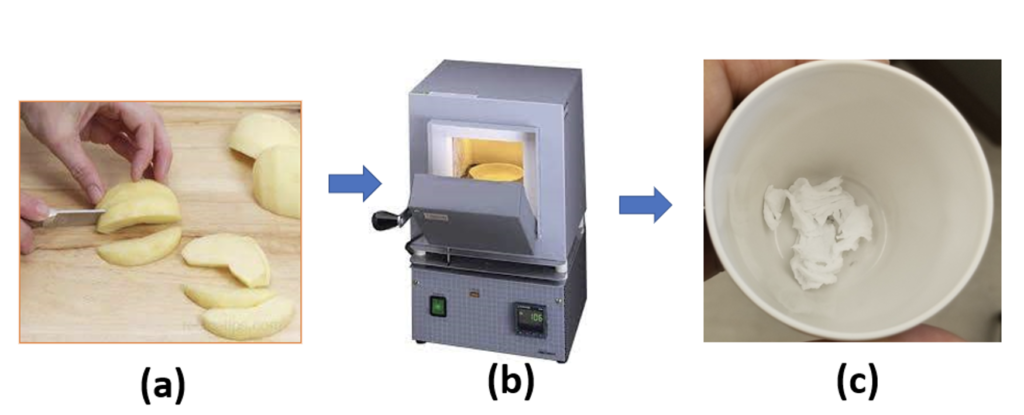
Clean apples of different varieties were collected from grocery stores in the Bismarck region (Walmart, Dans, Cashwise). The peels and the central hard part with seeds of each apple were removed. 25 g of the soft edible part of each apple were cut into small pieces and kept in the clean and dry crucible. These samples were then fired at 600 ⁰C for 24 hours in an ambient environment in MTI and Fischer furnaces. The apple pieces turned into white ash as shown in the figure 1. The crucibles were allowed to cool down to room temperature. In each experiment or for each crucible, 10 drops of concentrated HNO3 were added to dissolve all the ash. It was diluted by adding 2 mL of distilled water to dissolve or mix all the ash in the crucible. The solution was transferred to a 10 mL volumetric flask. The crucible was washed with 2 mL of distilled water and the wash was transferred to the volumetric flask. The crucible washing was repeated one more time. The whole of the solution (about 7 mL) in the volumetric flask was then diluted to 10 mL and mixed it well. 0.5 g of KSCN were added to the solution and shook well to dissolve it. It gives the dark red color of the solution. The solution was filtered before UV absorption measurement.
Preparation of standard solution
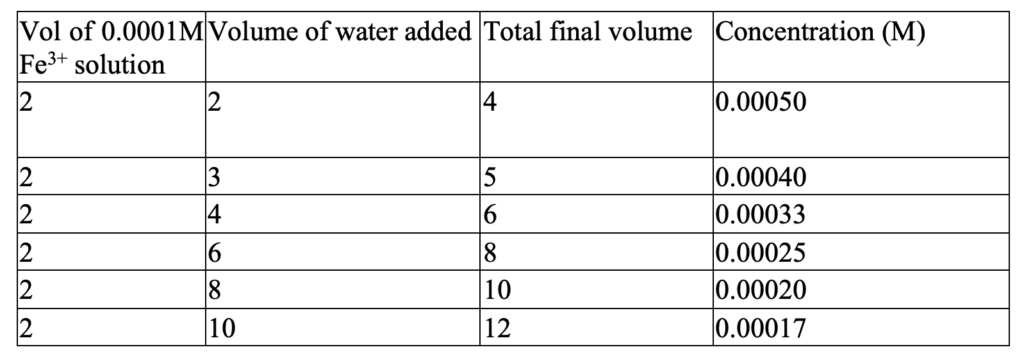
Standard solutions were prepared from FeCl3, HNO3, and KSCN to make a similar solution or environment as that of the sample solutions to be analyzed.[3] 0.162 g of FeCl3 was dissolved in a 100 mL volumetric flask with about 50 mL of water. 10 drops of concentrated HNO3 were added (to oxidize Fe2+ if any) and it was diluted with distilled water up to the mark (100 mL). HNO3 also lowers the PH and prevents the Fe3+ hydrolysis.[4] 0.5 grams of KSCN (excess amount) were added to the solution.[5] The solution was shaken well to mix it well. It was 0.001 M of Fe3+ solution. It was a dark red solution. 10 mL of the solution was transferred to another 100 mL volumetric flask and diluted to 100mL with distilled water. It was a standard solution of 0.0001M concentration. This solution was diluted to different concentrations as given in the following table 1.
Preparation of blank
10 drops of concentrated HNO3 were diluted with distilled water to 10 mL. 0.5 g of KSCN was added to it. The solution was shaken well. It was a colorless solution.
UV absorption measurement
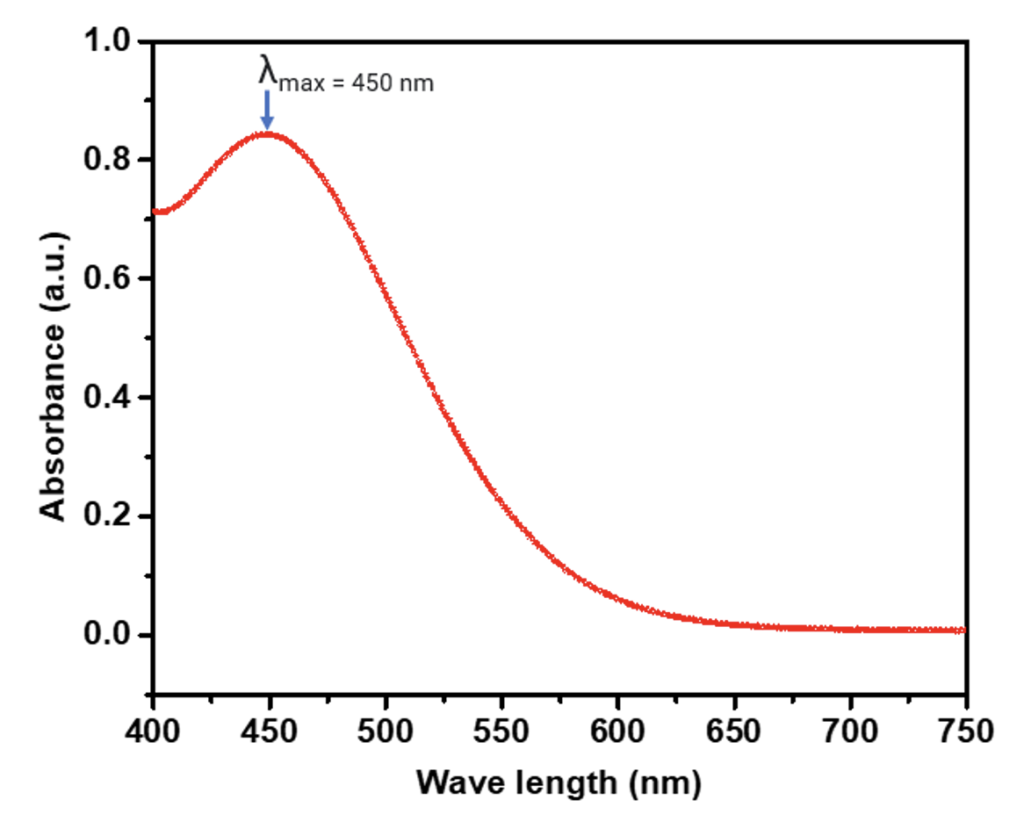
Genway UV vis and Evolution 1 UV viz were used for the measurement of UV absorption. Each time, the sample solutions were prepared and allowed to react (FeCl3 and KSCN)[4] for 5-10 minutes. The blank was used each time before measuring the UV absorption of the sample solutions. The λmax was first measured at variable wavelength and at a single wavelength for FeCl3 and KSCN mixture solution. Both the measurements showed the λmax at 450 nm. Then, all the measurements were accomplished at the same λmax.
Spectroscopic analysis and quantitative determination
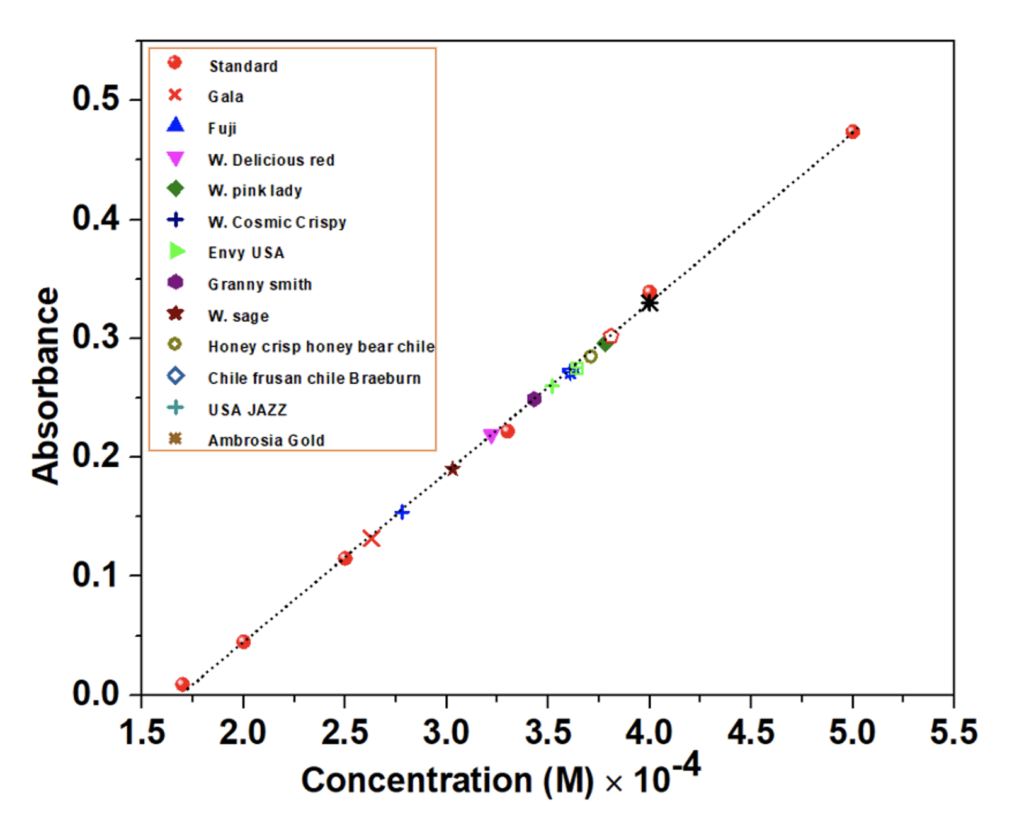
The quantitative analysis of the iron in the apples of different brands or places was performed by UV vis absorption analysis. Different apples under assessment were collected from local groceries such as Walmart and Dan’s market in Bismarck, North Dakota. All the measurements were carried out in the same environment and with the same mass of edible parts of the apples. First, the λmax was determined by measuring the absorbance of Fe(SCN)3[4] at various (continuous) wavelengths (ranging 400 – 750 nm) with the standard solutions and some of the test sample solutions in two UV vis equipment, Jenway and Evolution 1. The measurements showed λmax = 450 nm. The λmax was onceagain confirmed by measuring the absorbance at an individual wavelength ranging from 350 – 750 nm. Figure 2 represents a measurement of absorbance at various (continuous) wavelengths of a concentrated solution containing FeCl3 and KSCN.[4] All other measurements were accomplished at the same wavelength in the same conditions. Figure 3 shows the absorbance of different sample solutions and standard solutions at λmax = 450 nm. Among the 12 different apples listed in the inset of Figure 3 and Table 2, the maximum absorption was observed forAmbrosia and the lowest absorption was observed for Gala. A calibration curve was prepared from the standard solutions of different concentrations. Red spheres represent the absorbance at λmax = 450 nm in figure 3. Once the absorbance is obtained, it is used to determine the concentration as shown in figure 3. In figure 3, the highest concentration was observed for the sample solution prepared from Ambrosia apple and the lowest concentration was observed for the sample solution prepared from Gala apple.
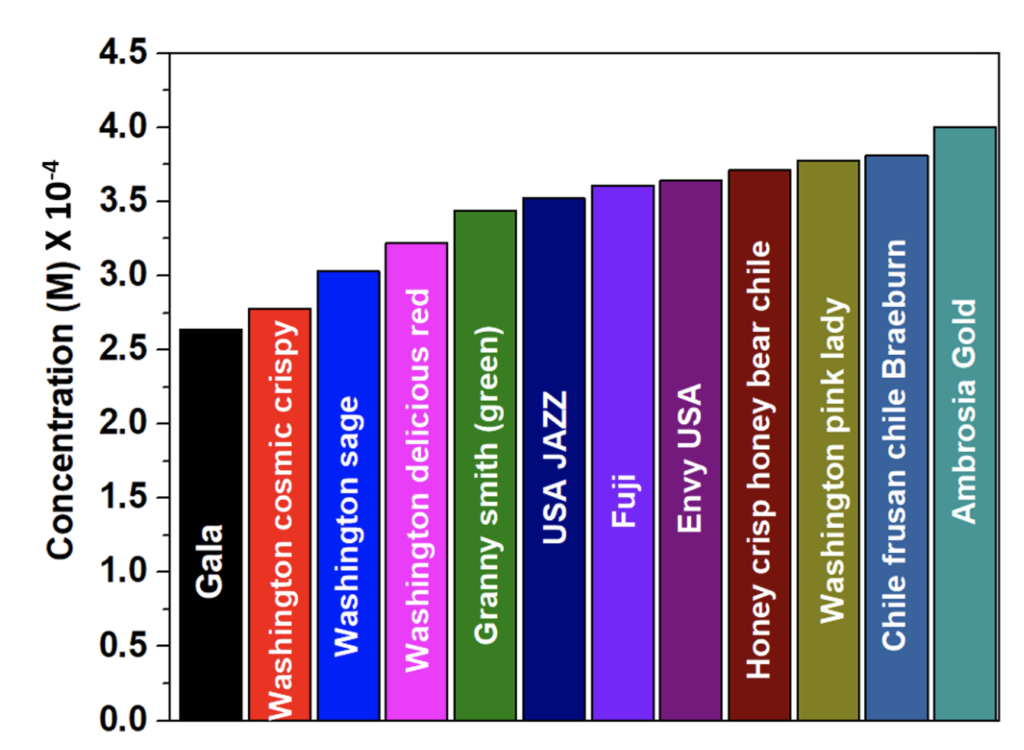
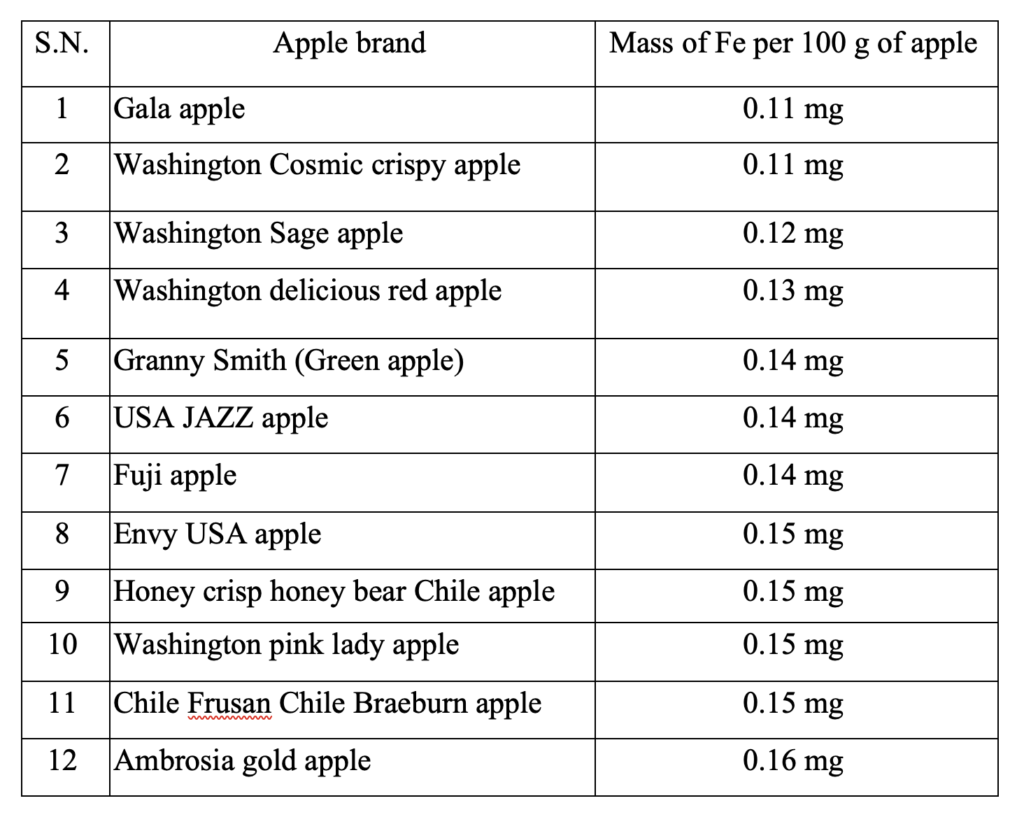
The concentration of each of the apples is shown in the bar diagram in figure 4. The concentrations were obtained from white ash dissolved in concentrated HNO3 solution and by mixing it with KSCN. 25 g of raw apples in each case were used for the sample preparation. The concentration was used to calculate the mass of iron in each apple per 100 g. The total mass of iron in each apple is shown in table 2.
The calculation performed to get mass was given as the following example:
Molarity is around 0.003M or 3 x 10⁻³ M.
It means,
1000 mL solution contains 0.003 g of iron.
10 mL of solution contains 0.00003g of iron.
10 mL of the solution is made of 25 g of apple.
So, 25 g of an apple contains 0.00003 g or 0.03 mg of iron.
100 g of an apple contains 0.12 mg of iron.
Or, simply the calculation can be implied as Mass = (M /10) x 1000 x 4 mg Fe per 100 g of apple
Conclusion
The studies reveal that Gala and Washington Cosmic Crispy apples contain 0.11 g of iron per 100 g of apple, which is the lowest amount among the studied apples. Granny smith (green apples), USA JAZZ and Fuji apples contain medium amount of iron. Envy USA, Honey Crisp Honey Bear Chile, Washington Pink Lady and Chile Frusan Chile Braeburn apples near the highest iron content. Ambrosia Gold apple has the highest amount of iron. So, according to this study, if someone is on iron supplement, it is better to have Gala apple and if someone needs iron supplement, it is better to eat Ambrosia Gold apple.
Acknowledgements:
This work is supported in part by the National Science Foundation Tribal College and University Program Instructional Capacity Excellence in TCUP Institutions (ICE-TI)award # 1561004, and we express gratitude to the program managers and review panels for project support. Additional support for the work came from ND EPSCOR STEM grants for research. Permission was granted by United Tribes Technical Colleges (UTTC) Environmental Science Department to publish this information. The views expressed are those of the authors and do not necessarily represent those of United Tribes Technical College.
References
1. Johnson-Wimbley, T.D. and D.Y. Graham, Diagnosis and management of iron deficiency anemia in the 21st century. Therap Adv Gastroenterol, 2011. 4(3): p. 177-84.
2. Goswami, T., A. Rolfs, and M.A. Hediger, Iron transport: emerging roles in health and disease. Biochem Cell Biol, 2002. 80(5): p. 679-89.
3. Prasad, R. and S. Prasad, Spectrophotometric Determination of Iron(III)–Glycine Formation Constant in Aqueous Medium Using Competitive Ligand Binding. J. Chem. Ed., 2009. 86(4): p. 494.
4. Cobb, C.L. and G.A. Love, Iron(III) Thiocyanate Revisited: A Physical Chemistry Equilibrium Lab Incorporating Ionic Strength Effects. J. Chem. Ed., 1998. 75(1): p. 90.
5. Berg, K.C.d., M. Maeder, and S.J.I.C.A. Clifford, A new approach to the equilibrium study of iron(III) thiocyanates which accounts for the kinetic instability of the complexes particularly observable under high thiocyanate concentrations. Inorg. Chimica Acta, 2016. 445: p. 155-159.
About the Authors
Tanner Veo

I am enrolled in Cheyenne River Sioux Tribe, but was previously enrolled in and grew up on the Crow Creek Sioux Tribe. Building on research discussed in this paper, I have plans to measure the iron content of vegetables grown in my college’s Sustainable Agriculture program using the same method. I am focused on nutrient levels in our environment and hope to one day measure the plastics and other “forever chemicals” in the soil and investigate how they affect our food supply. I am undecided if I will continue my education or work for my tribe’s Environmental Protection Agency after I graduate.
Ram Hona is a research mentor and member of UTTC’s Chemistry Faculty; Gurjot Dhaliwal is a member of UTTC’s Intertribal Research and Resource Center, Mandy Guinn is chair of the Environmental Science program.
• • •
Enjoyed this story? Enter your email to receive notifications.