By Elena Rodriguez
Abstract
North Dakota is the third largest producer of crude oil in the United States. The Fort Berthold Indian Reservation, located in west-central North Dakota, supplies nearly 20 percent of all oil production in the state (EIA, 2022). Due to the rapid growth of oil activity, it is essential to monitor groundwater quality since the chemicals used in the oil extraction processes increase the risk of health problems to humans and animals that utilize the groundwater sources. This research examined analyte concentrations from groundwater sources to determine if there was a correlation between analyte concentration and proximity to adjacent oil wells. During December 2021 and April 2022, groundwater samples were collected from wells and cattle stock tanks on the reservation. The water samples were analyzed for trace metals, nutrients, benzene, toluene, and total trihalomethane at the Sitting Bull College Analytical Laboratory and the North Dakota Department of Environmental Quality Chemistry Laboratory. In several samples, cadmium, fluoride, and sodium were above Environmental Protection Agency (EPA) drinking water standards; however, there was a low correlation between groundwater quality and proximity to oil wells. The low correlation suggests that the hydrology, natural deposits, and evaporation from the cattle stock tanks could be a factor in the concentrations of the analytes observed. Further studies should be conducted to characterize the points on the reservation that show high concentrations of analytes and examine the relationship to nearby oil activity.
Introduction
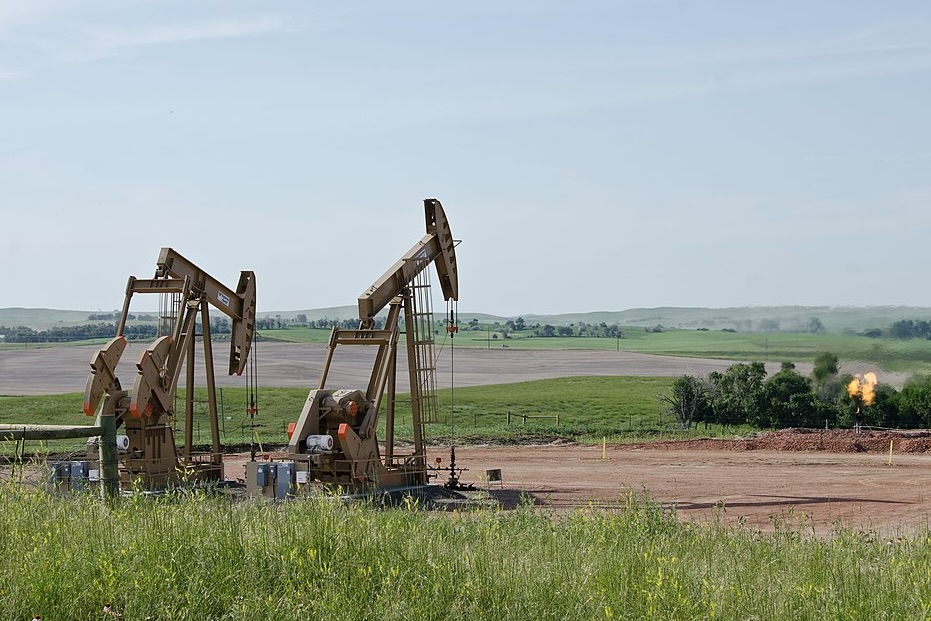
The Fort Berthold Indian Reservation (hereafter referred to as “reservation”) is home to the Three Affiliated Tribes. In the last decade, the reservation has had an increase in hydraulic fracking, gas flaring, and environmental spills associated with the oil industry. As a result of the increased oil activity, the reservation now generates roughly 20 percent of the oil produced by the state (EIA, 2022). According to the North Dakota Unified Spill Reporting System (2023), in 2022, the reservation had 77 contained and uncontained spills reported.
Oil extraction processes, such as hydraulic fracking, can contaminate drinking water in several ways. For example, oil spills, storm runoff, produced water spills, and the enforced pressure to bring the oil to the surface all pose the risk of groundwater contamination (Allen et al., n.d.). Furthermore, oil extraction byproducts increase the likelihood of high concentrations of salts, heavy metals, benzene, toluene, and other contaminants in the water (Allen et al., n.d.).
While there have been numerous studies elsewhere, there is no research on water quality in relation to the oil development on the reservation. Previous studies have observed the water budget of the reservation but were conducted before the oil boom hit the reservation (Cates & Macek-Rowland, 1995). Recently there was an assessment of the reservation’s water; however, no apparent correlation to the oil production was made (Lundgren & Iorio, 2020).
The reservation sits on top of the Three Forks and Bakken oil formations, which have been intensively drilled for oil and gas since 2008 (Wood, 2013). In the Bakken formation in western North Dakota, the produced waters have been recorded to be over ten times more saline than seawater (Peterman et al., 2017). Consequently, the Fort Berthold Indian Reservation is susceptible to companies releasing produced water into local tributaries (EPA, 2021). Furthermore, according to NOLA Ready (n.d.) drinking highly salinated water can cause cardiovascular disease, diarrhea, and abdominal pain. In addition to protecting the people and cattle, knowing how groundwater is influenced by nearby oil production can provide vital information to researchers studying the effects of oil development in a semi-arid region.
This research aims to identify analyte concentrations and compare them to the distance of the nearest oil well to determine if there is a correlation between them.
Methods
During December 2021 and April 2022, nine water samples were collected from wells and cattle stock tanks that utilized groundwater sources on the reservation. Volunteers for collection of groundwater samples were sought through social media. The criteria for inclusion in the study included those individuals who responded to the media campaign and had access to groundwater wells. Further requirements ensured that the well and cattle stock tanks were supplied with groundwater sources. Many landowners on the reservation no longer use groundwater as their water source due to the Fort Berthold Rural Water System, which supplies residents with treated water from Lake Sakakawea. Of the nine samples collected, four were residential, and five were cattle stock tanks.
Environmental Protection Agency (EPA) sampling protocols were followed to collect water samples. Samples were collected and analyzed for trace metals, nutrients, benzene, toluene, and trihalomethane. In addition, two blanks and two replicate samples were collected and analyzed for quality assurance. The trace metal samples were preserved with nitric acid, and the nutrient samples were preserved with sulfuric acid. As for the collection of organic analytes, the North Dakota Department of Environmental Quality Chemistry Laboratory protocols were used. They were preserved with hydrochloric acid with zero headspace.
The samples collected to be analyzed for benzene, toluene, and trihalomethane were sent to the North Dakota Department of Environmental Quality Chemistry Laboratory. A total of 22 constituents were analyzed at the Sitting Bull College Laboratory. An atomic absorption spectrometer was used to measure trace metals. In addition, an automated titration instrument known as the TIAMO was used to analyze pH, fluoride, alkalinity, and conductivity. Furthermore, a spectrophotometer and flow injection analysis were utilized to analyze major anions. Lastly, an inductively coupled plasma spectrometry (ICP) measured nutrients.
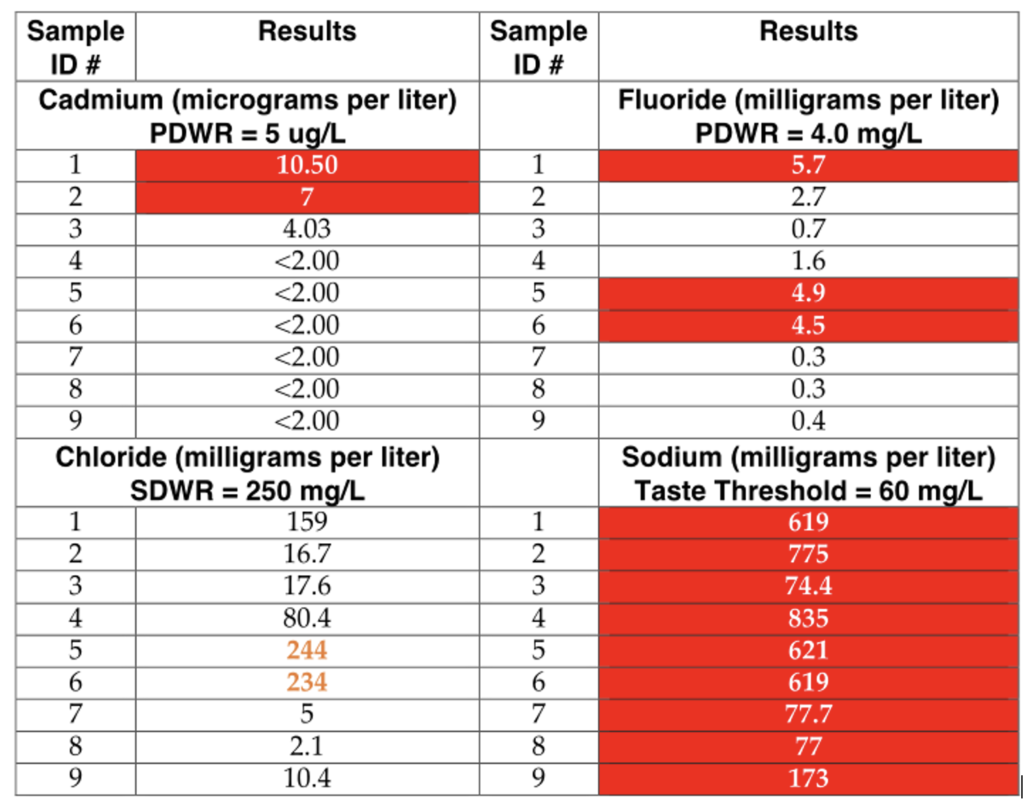
The resulting analyte concentrations were then compared to EPA primary drinking water regulations (PWDR), secondary drinking water regulations (SDWR), and taste threshold values. Of the constituents, only the analytes above EPA Maximum Contaminant Levels (MCL) were highlighted in this research. Afterward, the Google Earth measurement tool and satellite imaging was used to record the distance from the sample site to the nearest oil well. To determine a correlation between analyte concentration and adjacent oil well, a linear regression statistical method was run in Microsoft Excel.
Results
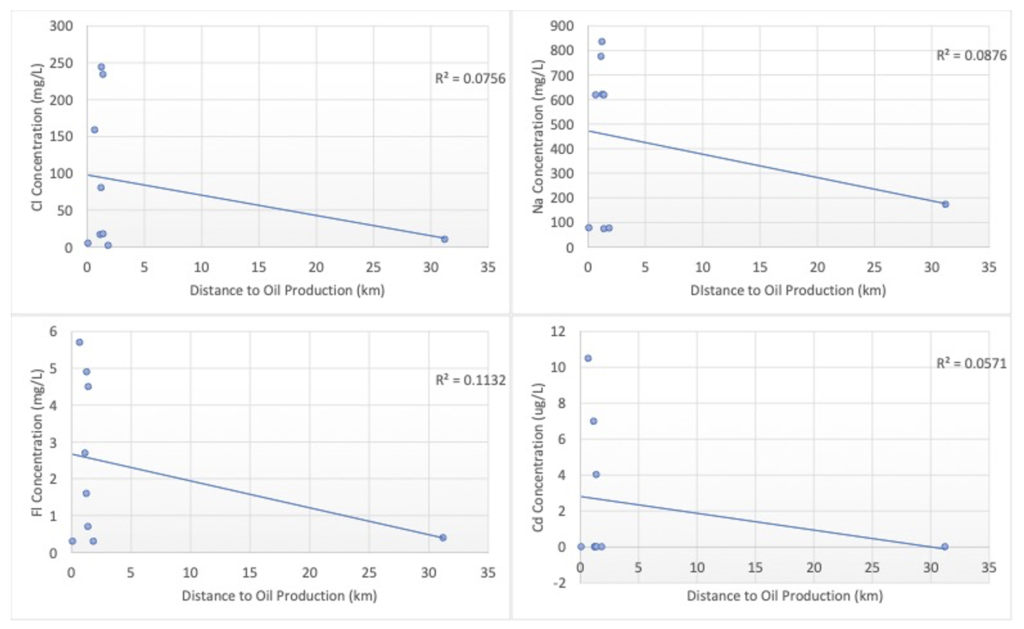
A total of nine water samples were collected from wells and cattle stock tanks that utilized groundwater sources. The closest distance between an oil well and the sample site was 0.68 km. The furthest oil well distance to the sample site was 31.21 km (outlier). Lastly, the average distance between an oil well and the sample site was 4.48 km. Four constituents (Cd, Cl, Fl, and Na) showed elevated water concentrations compared to the Environmental Protection Agency (EPA) Primary and Secondary Drinking Water Regulations. As seen in Figure 1. The constituents had several samples test above EPA maximum contaminant levels (MCL). Chloride did not test above EPA drinking standards but was included due to its ionic bonding behavior with sodium. Total trihalomethane was only analyzed for the first three samples. However, it was found in sample #2 at 50.26 ug/L, which is below EPA’s maximum contaminant level.
Ultimately, all analytes showed a low correlation between water concentrations and distance to oil production. The highest correlation was fluoride (R2 = 0.1132). The lowest correlation was cadmium (R2 = 0.0571). As for chloride, roughly 7% could be explained by the distance to oil production (R2=0.0756). Finally, sodium had a correlation to oil proximity at about 8% (R2=0.0876).
Discussion
Ultimately, the data did not support the hypothesis that there is a relationship between analyte concentrations and oil proximity. Several factors, including the small sample size, could explain this. More samples could have provided a better representation of the population. In future studies, obtaining records of the groundwater wells on the reservation may result in additional samples being collected. Furthermore, the hydrology and natural deposits in the area could explain observed analyte concentrations. Lastly, sampling from cattle stock tanks poses the risk of evaporation of organic elements and can lead to lower sample concentrations.
For future studies, more organic elements should be analyzed. For example, this analysis should include total trihalomethane, which is normally not found in groundwater but was present in sample number two. In addition, more research is needed to determine if TTM is an issue in the groundwater. Finally, the high amounts of sodium chloride require further analyses to examine if there is a relationship to brine spills in the area.
Above all, water monitoring in areas with high energy production is crucial to ensure that people and wildlife are supplied with safe drinking water. With the high rates of kidney failure and high blood pressure amongst Native communities, it can be life-threatening if sodium is not restricted in their diet. However, with increased monitoring of groundwater and safety practices in the oil industry, improvements can be made to protect the wildlife and communities of the Fort Berthold Indian Reservation.
References
Allen, L., Cohen, M. J., Abelson, D., & Miller, B. (n.d.). Fossil Fuels and Water Quality. The World’s Water Volume 7. Retrieved October 14, 2021, from https://observatoriopantanal.org/wp-content/uploads/crm_perks_uploads/5cb0f734750a11456042675850236/2019/08/2012_Fossil_Fuels_and_Water_Quality.pdf.
Cates, S. W., & Macek-Rowland, K. (1995). Water Resources of the Fort Berthold Indian Reservation, West-Central North Dakota. United States Geological Survey.
Environmental Protection Agency. (2021, April 12). EPA proposes settlement with Arrow Midstream to resolve produced water releases on the Fort Berthold Indian Reservation in North Dakota. EPA. Retrieved January 30, 2023, from https://www.epa.gov/newsreleases/epa-proposes-settlement-arrow-midstream-resolve-produced-water-releases-fort-berthold.
Incidents. Unified Spill Reporting System, North Dakota. (2023). Retrieved February 25, 2023, from https://www.spill.nd.gov/
Lower Mississippi Saltwater Intrusion. Saltwater FAQs – NOLA Ready. (n.d.). https://ready.nola.gov/incident/saltwater-intrusion/saltwater-faqs/?utm_source=nola&utm_medium=banner#:~:text=The%20health%20effects%20of%20drinking,regarding%https://ready.nola.gov/incident/saltwater-intrusion/saltwater-faqs/?utm_source=nola&utm_medium=banner#:~:text=The%20health%20effects%20of%20drinking,regarding%20your%20specific%20health%20risks.20your%20specific%20health%20risks.
Lundgren, R.F., and Iorio, M.J., (2020). Characterization of surface-water and groundwater quality on the Fort Berthold Reservation, North Dakota, 2014–17: U.S. Geological Survey Scientific Investigations Report 2020–5020, 37 p., https://doi.org/10.3133/sir20205020.
U.S. Energy Information Administration. (2022, June 16). North Dakota, State Profile and Energy Estimates. Independent Statistics and Analysis. Retrieved February 17, 2023, from https://www.eia.gov/state/analysis.php?sid=ND#119.
Wood, J. (2013). North Dakota tribes’ oil output rivals US states. IMDiversity. Retrieved December 1, 2021, from https://imdiversity.com/diversity-news/north-dakota-tribes-oil-output-rivals-us-states/.
About the Author

A member of the Three Affiliated Tribes, Elena Rodriguez grew up in New Town, North Dakota. Currently living in Fort Yates, North Dakota, she attends Sitting Bull College, where she is completing an undergraduate degree in Environmental Science, pursing interests in water quality and bioremediation. A first-generation college student, Rodriquez plans to obtain a Ph.D. in land rehabilitation or environmental engineering. Once completed, she hopes use her degree to help Native American communities combat local environmental issues. She also wants to develop STEM kits that tie in Native American culture, to connect more Native American youth to science.
• • •
Enjoyed this story? Enter your email to receive notifications.