
By Erin Graeze Ortiguero and Dr. Rebecca Romine
Abstract
There is a high prevalence of diabetes in non-Caucasian populations. Most of the Hawaiian islands’ population consists of non-Caucasian populations such as Asians and Pacific Islanders. One of the most prevalent chronic diseases in the Hawaiian islands’ population is diabetes. Thus, our aim is to examine the prevalence of pre-diabetes and diabetes in a cohort of at-risk college-aged students at the University of Hawaii West O’ahu campus. A total of 25 participants aged 18-26 years with no known diagnosis of diabetes participated in the experiment. The participants were split into three designated groups: Oral Glucose Tolerance Test (OGTT) group, the glucose sip-and-spit (GSS) group, and the water-only (WO) control group. Results for each group were as expected. The GSS and WO did not increase in blood glucose levels over time. The OGTT group results had an initial increase in blood glucose concentration followed by a decrease in the blood glucose concentrations by the 120-min mark. The data revealed that 60% of the individuals in the OGTT group exhibited impaired glucose tolerance, with blood glucose levels above normal values (>140 mg/dL and <200 mg/dL).
Introduction
According to the World Health Organization (2020), more than 422 million individuals have Type 2 diabetes, and this number has steadily increased. However, some ethnic groups, such as Asian-Americans and Pacific Islanders, suffer from higher rates compared to the Caucasian population. Most of the Hawaiian islands’ population consists of Asian and Pacific Islander ancestry (Maskarinec et al, 2010). The diabetes epidemic may be linked to the increase in obesity and changes in lifestyle associated with lack of physical activity and high-calorie intake diet (Maskarinec et al, 2010; Mauvais-Jarvis, 2017; Steinbrecher, Erber, Grandinetti, Kolonel, & Maskarinec, 2010). In a Hawaii Department of Health report (2016), 57% of Hawaii’s adult population were considered overweight or obese; these individuals account for the estimated 54% of Hawaii’s population that has type 2 diabetes or prediabetes.
Early detection of the disease to change lifestyle to prevent further complications. The oral glucose tolerance test (OGTT) is used to assess blood glucose concentrations, the results of which can be used to help diagnose prediabetes, impaired glucose tolerance (IGT), and diabetes mellitus (DM) (Huang, Ou, & Karnchanasorn,2015).
Individuals with diabetes spend more on healthcare and have fewer productive years compared to those that do not have diabetes. Diabetes complications include heart disease, stroke, blindness and other eye problems, kidney disease, and nerve damage. According to the Centers for Disease Control and Prevention (2019), early detection can not only lead to prevention of severe diabetes complications but can also improve quality of life and lower health care costs. Thus, the purpose of this experiment was to test the postprandial and fasting blood glucose values in a cohort of at-risk college-aged students to determine the prevalence of pre-diabetes and diabetes.
Research Design and Methods
A cohort of 25 college-aged students between 19 and 26 years of age enrolled in the anatomy and physiology course at University of Hawaii West O‘ahu (UHWO) participated in the lab course-based experiment. All participants continued their routine physical activities and completed a modified fast the day of the experiment.
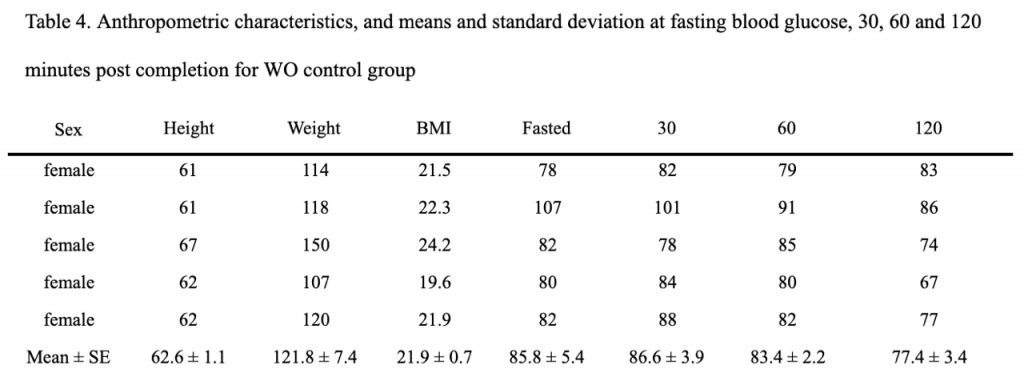
Before the experiment began, participants were given a brief tutorial in finger-stick technique, the operation of the glucometer, and biohazardous waste disposal. Participants were placed into one of three groups: an oral glucose tolerance test (OGTT), a glucose sip and spit (GSS), and water only (WO). Immediately after, their anthropometric measurements, including their height and weight were obtained. Body mass index (BMI) was calculated, and fasting blood glucose levels were measured. Immediately after the fasting blood glucose levels were measured, subjects completed ingestion requirements assigned to each group.
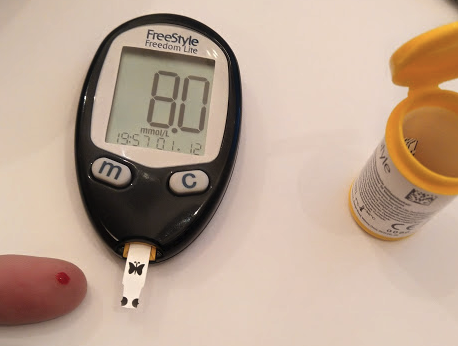
The OGTT group ingested a 296 mL 75-g glucose solution and was permitted five minutes to comfortably ingest the glucose solution. Participants in the GSS ingested 25 mL of the same 75-g glucose solution to take into their mouths, swished it around, immediately dispelled into a nearby sink. The WO control group ingested 500 mL of water only. The blood samples were collected from the participants using fully enclosed, self-sheathing lancets. All blood glucose values were measured using a glucometer. Blood glucose levels were obtained and recorded at 0, 30, 60, and 120 minutes.
For the sample data set, all values are reported as mean SE. Two-way ANOVA statistical analysis was conducted using Microsoft Excel Version 16.47.1 to determine significant differences between OGTT, WO, and GSS groups.
Results
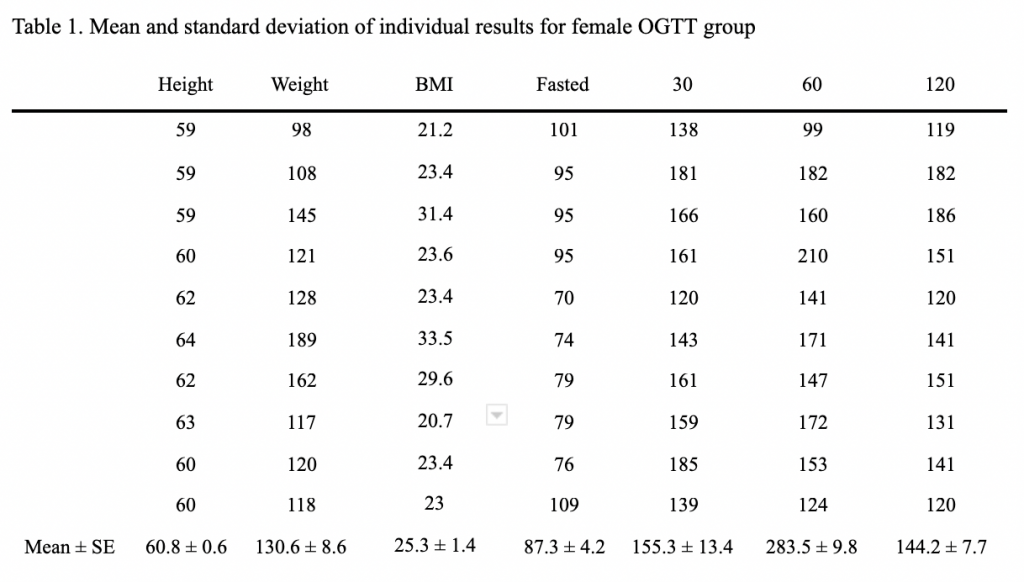
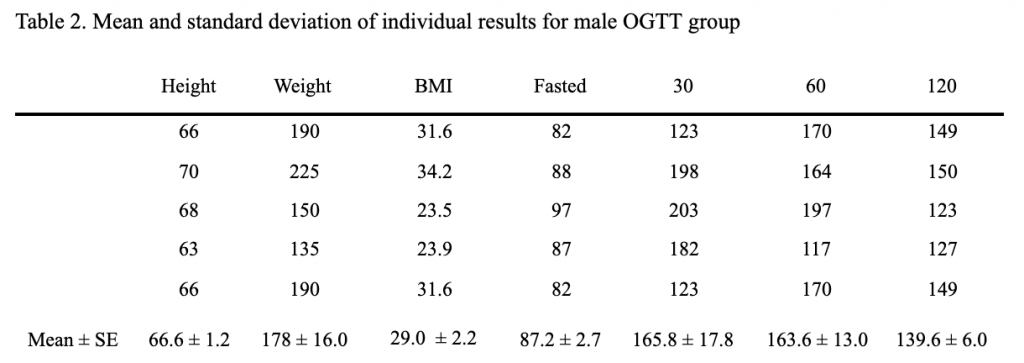
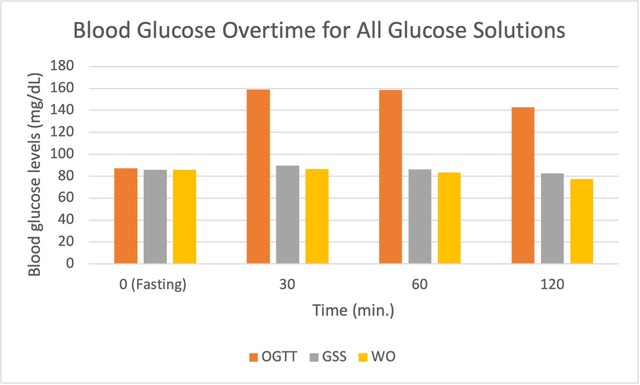
The comparison between blood glucose concentration values over time between OGTT, GSS, and WO clarified that the OGTT test was valid and statistically significant (each P<0.05). For all groups except WO, based on BMI, subjects were considered overweight (>25.0). Among males, the overall average blood glucose values over time were normal (Table 2), However, for females, the average blood glucose values were all above the normal values except for the fasting blood glucose concentration (Table 1).
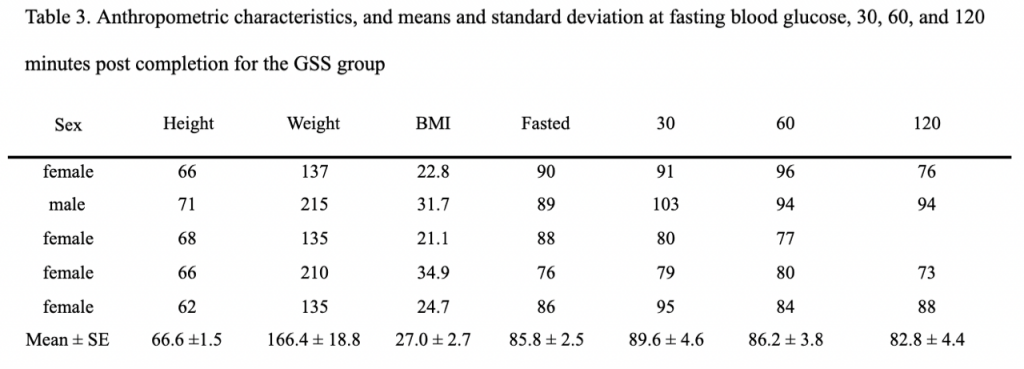
The GSS and WO did not increase in blood glucose levels over time. On the other hand, OGTT group results revealed an initial increase in blood glucose levels that were significantly higher compared to GSS and WO values (Figure 1). Additionally, for the OGTT group, instead of the blood values decreasing by the 120-minute mark, the values have increased or stayed at a level above normal blood values.
Discussion
Ethnicity and race data were excluded from the results because the information could have been used to identify subjects. However, according to the UHWO Institutional Research, Analysis & Planning Office (2020) student demographics consists of Caucasian (11%), Chinese (2%), Filipino (22%), Hawaiian or part Hawaiian (29%), Japanese (4%), Mixed (16%), Pacific Islander (2%), and other ethnicities (15%). Thus, this student cohort consisted of subjects considered high risk for diabetes based on their ethnicity.
Blood glucose levels >125 mg/dL at 120-minute postprandial are considered within normal limits for an OGTT. The GSS and WO did not increase in blood glucose levels over time. However, the OGTT group results showed elevated blood glucose levels. In the current study, averaged blood glucose levels for females in the OGTT group were 144 mg/dL, with the majority of the female subjects (60%) with blood glucose concentration levels at 120-minute post-prandial greater than 140 mg/dL, exhibiting impaired glucose (IGT) (Hopper & Maurer, 2013). While male subjects in the OGTT averaged just below 140 mg/dL, three subjects exhibited elevated blood glucose levels at the 120-minute mark, indicative of IGT. Glucose responses for oral glucose tolerance tests differ between men and women, the glucagon suppression is greater in men than in women which suggests that glucose responses during the oral glucose tolerance tests are affected by the differences between genders in their bi-hormonal responses Mauvais-Jarvis, 2017).
Both genders have an average BMI that falls into the overweight category (>25.0). BMI has a strong relationship to developing diabetes and insulin resistance. Any individual that is overweight and/or obese has some kind of insulin resistance, and diabetes develops in individuals that lack sufficient insulin secretion to match the degree of insulin resistance (Al-Goblan, Al-Alfi, & Khan, 2014). On the other hand, the males’ overall average blood glucose values over time were normal. For females, however, the average blood glucose values were all above the normal values except for the fasting blood glucose concentration (Mauvais-Jarvis, 2017).
Baseline (fasted) blood glucose levels on average were normal. However, two OGTT subjects and one WO subject demonstrated blood glucose levels that exhibited IGT and pre-diabetes (100-125 mg/dL). All three students exhibited normal blood glucose 120-minute postprandial, the three students that exhibited IGT with their fasting blood glucose, no longer indicate the possibility of IGT (140-200 mg/dL).
Despite unexpectedly having 60% of the OGTT group exhibit IGT blood values, no subject in the study fell into the diabetes category. Postprandial glucose is a sensitive indicator of the risk for developing diabetes and an early marker of impaired glucose homeostasis. The development of IGT indicates that this may eventually develop diabetes. However, early detection allows more time to prevent further progression into developing diabetes. It is important to keep in mind that this experimental study was not and should not be used in place of a diagnosis and testing made by a medical professional.
Conclusion
This study has observed the prevalence of pre-diabetes from the non-Caucasian population of at-risk college-aged students. The most noteworthy finding was the number of students that displayed the possibility of exhibiting impaired glucose tolerance. Almost the majority of the OGTT group displayed high values of blood glucose concentrations. In terms of their BMI, it was not directly affecting the individual’s blood glucose values. Although as research has reported, there is a greater prevalence of diabetes for ethnic groups. When compared to the rest of the nation, Hawaii has higher percentages of diabetes cases, especially for the Asian, Hawaiian/Pacific Islander, and multiracial population, which matches the student demographic that exhibited possible cases of pre-diabetes. Although, with the early detection of possible cases of pre-diabetes and diabetes, it will prompt better treatment to prevent complications.
References
Al-Goblan, A., Al-Alfi, M., & Khan, M. (2014, December 4). Mechanism linking diabetes mellitus and obesity. Retrieved from https://www.ncbi.nlm.nih.gov/pmc/articles/PMC4259868/
Anderwald, C., Pfeiler, G., Nowotny, P., Anderwald-Stadler, M., Krebs, M., Bischof, M. G.,Waldhäusl, W. (2008). Glucose turnover and intima media thickness of internal carotid artery in type 2 diabetes offspring. European Journal of Clinical Investigation, 38(4), 227–237. doi: 10.1111/j.1365-2362.2008.01932.x
Centers for Disease Control and Prevention. (2019, October 21). Put the brakes on diabetes complications. Retrieved March 31, 2021, from https://www.cdc.gov/diabetes/library/features/prevent-complications.html
Department of Health. (2016, December 15). Hawaii ranks first for health in the nation but state data shows areas of concern. Retrieved from https://health.hawaii.gov/news/files/2013/05/16-090-Hawaii-Ranks-First-for-Health-in-the-Nation-but-State-Data-Shows-Areas-of-Concern.pdf
Hopper, M. K., & Maurer, L. W. (2013). Laboratory exercise: study of digestive and regulatory processes through the exploration of fasted and postprandial blood glucose. Advances in Physiology Education, 37(3), 254–263. doi: 10.1152/advan.00172.2012
Huang, J., Ou, H., & Karnchanasorn, R. (2015). clinical implication of fasting and post-challenged plasma glucose in diagnosis of diabetes mellitus. Endocrine, 511–518.
Institutional Research, Analysis & Planning Office. (2020). UH West O‘ahu: At a Glance. Retrieved March 31, 2021, from https://www.hawaii.edu/campuses/westoahu
Maskarinec, G., MD, PhD, Grandinetti, A., PhD, Matsuura, G., MPH, Sharma, S., PhD, Mau, M., Henderson, B. E., MD, & Kolonel, L. N., MD. (2010). Diabetes Prevalence and Body Mass Index Differ by Ethnicity: The Multiethnic Cohort. Diabetes Prevalence and Body Mass Index Differ by Ethnicity: The Multiethnic Cohort.
Mauvais-Jarvis, F. (2017). Gender differences in glucose homeostasis and diabetes. Physiology and Behavior, 20–23.
Steinbrecher, A., Erber, E., Grandinetti, A., Kolonel, L., & Maskarinec, G. (2010). Meat consumption and risk of type 2 diabetes: The Multiethnic cohort. Public Health Nutrition, 14(4), 568-574. doi:10.1017/s1368980010002004
World Health Organization. (2020). Diabetes. Retrieved March 31, 2021, from https://www.who.int/health-topics/diabetes
About the Authors

Erin Graeze Ortiguero was born in the Philippines and raised in Ewa Beach, Hawai’i. Recently graduated from the University of Hawaii West O’ahu with a bachelor’s degree in Applied Science in Health Professions with a concentration in Pre-Physician Assistant, she is planning to pursue a master’s degree in public health and later enroll in a physician assistant program. She hopes to use the knowledge and experiences gained from her education to improve healthcare for the poor and the underserved in Hawai’i.
Dr. Rebecca Romine is an assistant professor of anatomy & physiology at the University of Hawaii West O’ahu.
• • •
Enjoyed this story? Enter your email to receive notifications.